The proposed device is a microcontroller-based prototype, leveraging a sensor as its input device. Affixed to a glove, it relies on hand movements as its main source of input. This also allows the presenter to have free use of both of their hands for props or other actions during presentations. Attached is the link to a demonstration of the working prototype.
The firmware is implemented in Arduino that uses processed motion input from the MPU6050 sensor to control the mouse cursor on a connected device. The Inter-Integrated Circuit (I2C) Device Library is the main library used for this implementation. It is a library that simplifies communication between devices that use the I2C protocol, a serial communication and bus interface connection protocol to connect multiple devices through a shared bus. This is referenced from I2C Dev Library of Jeff Rowberg. Two versions of the prototype device were proposed, one using a 0.5 sensitivity factor with a 16 X-threshold and an 8 Y-threshold value, and the other using a 0.625 sensitivity with an 8 X-threshold and a 4 Y-threshold
- Open gyro_mouse folder using the Arduino IDE.
- Import the mouse library using the built-in library manager.
- Upload to Arduino. Note: Ensure that the correct COM port and board are selected.
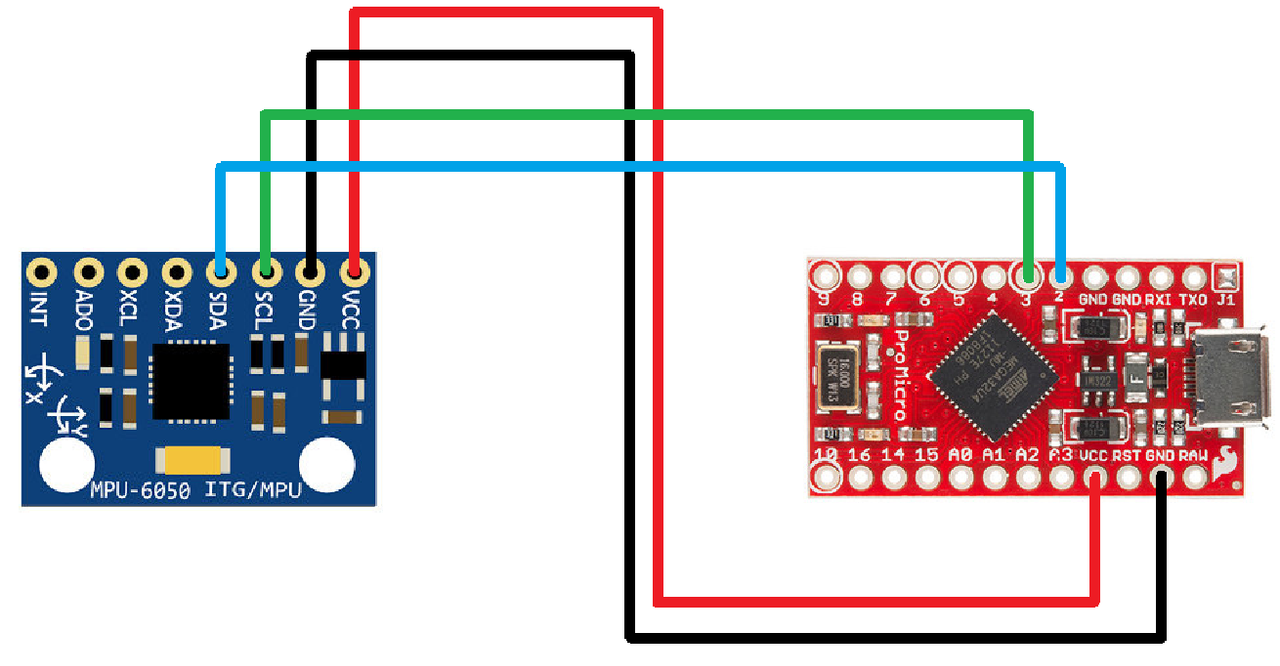
To build the prototype, hardware components include an Arduino Pro Micro, an MPU-6050 sensor, breadboards, and male-to-male cables. All components are attached to the microprocessor as shown in the circuit schematic diagram below.
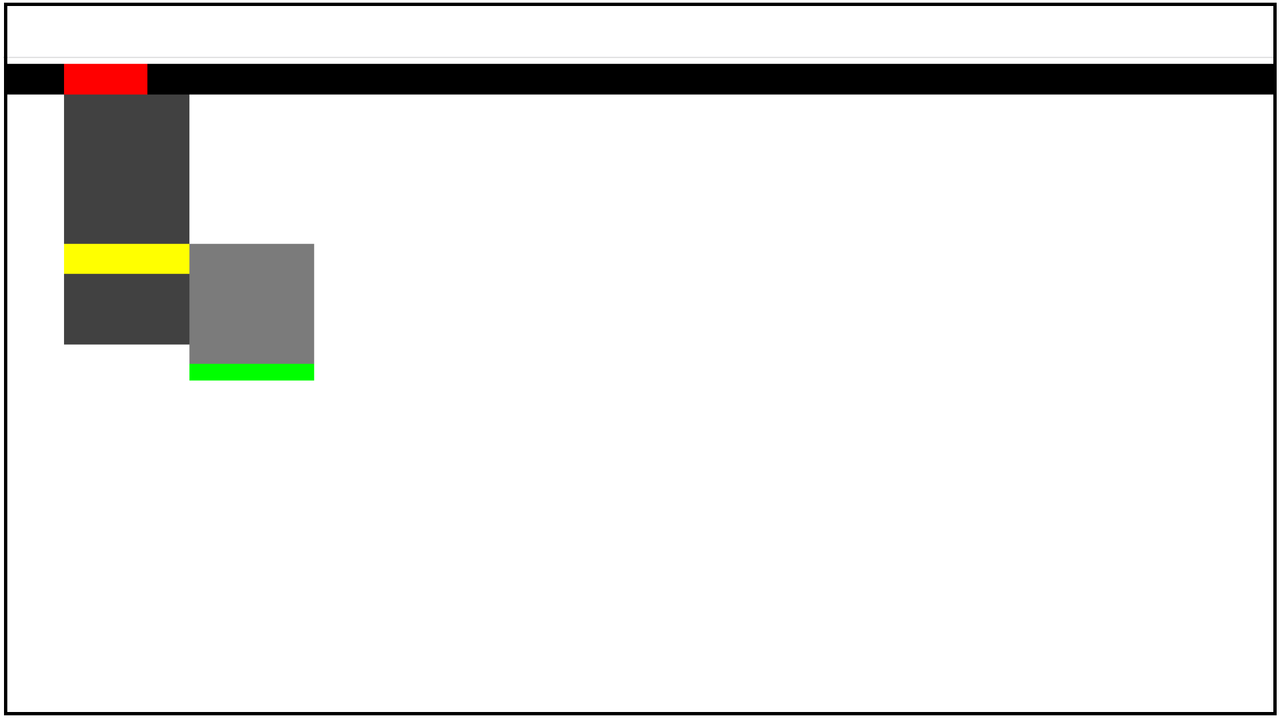
To assess the effectiveness of the proposed prototype, a navigation task adapted from a hierarchical menu is delivered through an HTML page depicting an abstract display similar to the Figure below. This may be loaded through the navigation_task.html file.
A T-test was calculated to determine if there was a significant difference among the performances of the three devices involved in the study as gathered through the testing done. A comparative visual examination of the performance metrics across the three groups was also conducted through data visualization techniques, such as box plots, histograms, and line graphs, to provide a comprehensive understanding of the differences in performance among the control group (original interface) and the two versions of the proposed prototype. This was all done through a series of Jupyter notebooks located in the folder Jupyter Notebooks for Analysis.