Overview
- This project used web scraping to grab US governor polling data from the Real Clear Politics website.
- Data are parsed into a convenient structure
- Data are analyzed by bootstrap resampling in the purpose of estimating the level of precision of historical polls to the outcome.
Input: Polling ID Output: Govenor candidates' winning rate over election period
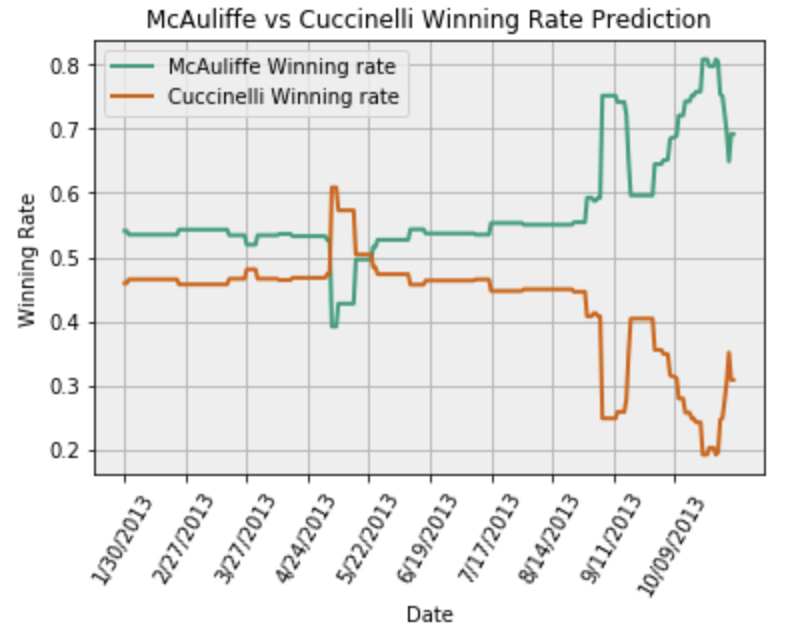
- Example:
Input: Polling ID = 3033 Output:
Additional library
- requests: de facto standard for making HTTP requests in Python
- pattern3: used to parse XML
- beatifualSoup: used to parse HTML
- fnmatch: Unix filename pattern matching; used to find URL in web text
Analysis In bootstrap resampling
- Original data, ∑, are resampled to n new ∑* where ∑* has length B, which can be customized by users (e.g. ∑ = (x0, x1, x2, x3), then ∑* ≔ (x2, x1, x1, x3, x0) where B =5)
- Notice, if B is small, the distribution can be biased, then we have to analyze it on Cumulative Distribution Function (CDF). The variance of the distribution is proportional to 1/N^2 with a constant bias 1/BN, where N is the length of ∑. This is why we need to ensure B is large enough so that we could ignore the bias. Case Methodology
- Collect all historical election data
- Calculate normalized errors between historical data and final winning result
- According to current polling data of target election candidates, predict final result by historical errors through the following function
def PredictResultByBoostrap(hitorical_error, c1, c2, B = 10000): N = errors.shape[0] B = B resam_error_list = [] np.random.seed(int(time.time())) resam_error_list = [errors.error.values[j] for j in np.random.randint(N, size = B)] c1_actual = pd.Series([c1-x for x in resam_error_list]) c2_actual = pd.Series([c2+x for x in resam_error_list]) p1 = (c1_actual > c2_actual).mean() p2 = 1-p1 return p1, p2 return p1, p2
Reference from https://nbviewer.jupyter.org/github/cs109/content/blob/master/HW1.ipynb