Generate directed graphs of the IR of a function call.
] add https://github.com/shashikdm/TraceGraph.jl
using TraceGraph
using GraphPlot
Declare your functions:
function foo(a)
  b = a+10
  c = b+10
  return (a,b,c)
end
Call generategraph as follows
tg = tracegraph(foo, 10)
tg is an object of type TGraph which consists of following fields:
:g: Object of type SimpleDiGraph:nodelabel: Vector of strings of unique names to the names:nodeop: Vector consisting of operation of each node:nodevalue: Vector of values of each node
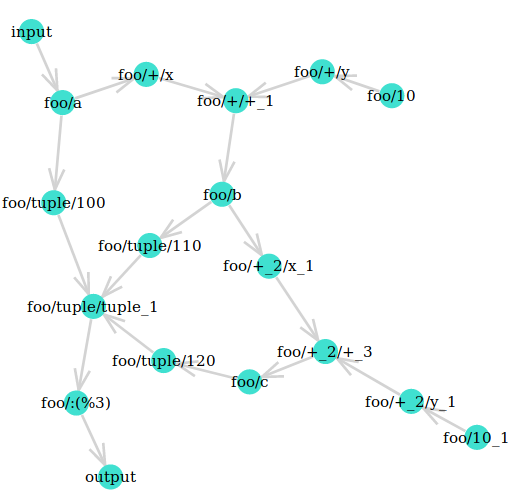
Then call gplot or gplothtml to plot the graph
gplot(tg.g, nodelabel = tg.nodelabel)
#OR
gplothtml(tg.g, nodelabel = tg.nodelabel)
The resulting plot will look something like :