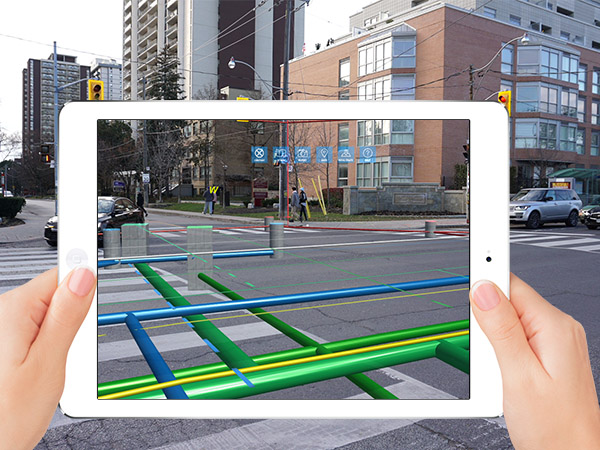
vGIS Utilities displays infrastructure in-field and in real-time, helping field workers locate the correct assets faster, saving time and preventing costly errors.
The #1 utility-grade augmented reality (AR) system for Esri GIS is designed for municipalities and public utility companies. vGIS Utilities transforms traditional "flat" GIS data into augmented reality displays, and holograms overlain your view of a physical job site.
Use a device already in your pocket—Android phone, iPhone, or a tablet—or even the futuristic Microsoft HoloLens to "see" your underground utility infrastructure as you tour a work area. Water pipes, sewage systems, gas and electrical lines appear in your field of view as a natural extension of the real world.
vGIS creates instant awareness of your surroundings, saving you time and helping you avoid costly mistakes. Explore the case study below to learn more about vGIS's real-life benefits.

A geographical overview of the assets in your project. Entirely modify the map style and specify the icons and colours for your asset types. Click on an asset to get detailed information and a direct link to the assets page.


With rules, you can let assets work together to create intelligence. You can process and manipulate data to create new information, and you can set conditions to trigger actions. The latter can be used to set up alerts or automatically control devices based on sensor values.


A goal of journalism is to bear witness to history as faithfully as possible. This is especially true for photo and video journalists, who put themselves close to the action to visually document events.
Visual journalists are always searching for new technologies to capture more detail and get the news out faster. But they've operated within the constraints of a camera lens, a two-hundred-year-old technology that gives readers a single, 2D representation of an event.
Photogrammetry is a process that involves taking dozens or hundreds of still photographs and using software to stitch them together into a 3D mesh. The software looks for similarity between the photos and then uses parallax, or the relationship between objects in the foreground and the background, to create depth.

Creating a 3D model using photogrammetry requires capturing multiple overlapping images of a space and stitching them together with software.

Photogrammetry software identifies each image's shared features and uses the position of the camera to calculate depth.
An extension to GeoJSON that encodes topology and allows compact, delta-encoded coordinates.
TopoJSON is a JSON format for encoding geographic data structures into a shared topology. A TopoJSON topology represents one or more geometries that share sequences of positions called arcs. TopoJSON, as an extension of GeoJSON, supports multiple geometry types: Point, LineString, Polygon, MultiPoint, MultiLineString, MultiPolygon, and GeometryCollection. Geometries in TopoJSON may contain additional properties to encode non-geometrical data.
{
  "type": "Topology",
  "transform": {
    "scale": [0.0005000500050005, 0.00010001000100010001],
    "translate": [100, 0]
  },
  "objects": {
    "example": {
      "type": "GeometryCollection",
      "geometries": [
        {
          "type": "Point",
          "properties": {
            "prop0": "value0"
          },
          "coordinates": [4000, 5000]
        },
        {
          "type": "LineString",
          "properties": {
            "prop0": "value0",
            "prop1": 0
          },
          "arcs": [0]
        },
        {
          "type": "Polygon",
          "properties": {
            "prop0": "value0",
            "prop1": {
              "this": "that"
            }
          },
          "arcs": [[1]]
        }
      ]
    }
  },
  "arcs": [
    [
      [4000, 0],
      [1999, 9999],
      [2000, -9999],
      [2000, 9999]
    ],
    [
      [0, 0],
      [0, 9999],
      [2000, 0],
      [0, -9999],
      [-2000, 0]
    ]
  ]
}.gif)
Everyday cameras and computer vision algorithms are digitizing construction projects to keep builders on schedule. Based in Tel Aviv, Buildots maps output from building-site cameras onto simulations of the work in progress, enabling construction managers to monitor progress remotely. At least two large European builders are using the system, according to MIT Technology Review.
Why it matters: Mistakes can become delays that add to a construction project's cost. Market research firm McKinsey estimated that the construction industry could add $1.6 trillion to the global GDP by catching mistakes before they cause severe delays.
How it works: A client supplies to Buildots blueprints and plans, including schedules and lists of parts, to complete each task involved in a building project. Buildots supplies GoPro 360-degree cameras mounted atop hardhats.
- The company uses the blueprints to build a detailed 3D mockup, known as a digital twin, of the finished building.
- Cameras worn by workers upload pictures to a remote server where image recognition software identifies and tracks as many as 150,000 objects.
- The system determines whether the objects are where they're supposed to be and whether they've been fully installed. Then it updates the mockup appropriately. Managers can track progress via an online dashboard. They receive email or text alerts when tasks fall behind schedule.
Dendron is a local-first, markdown based, hierarchical note-taking application built on top of VSCode and friends.
Think of it as a second brain to help you make sense of all the information you care about.
Some potential use cases include:
- project management
- personal knowledge base of things you've learned
- CRM to keep track of clients, friends and enemies
- recipe book
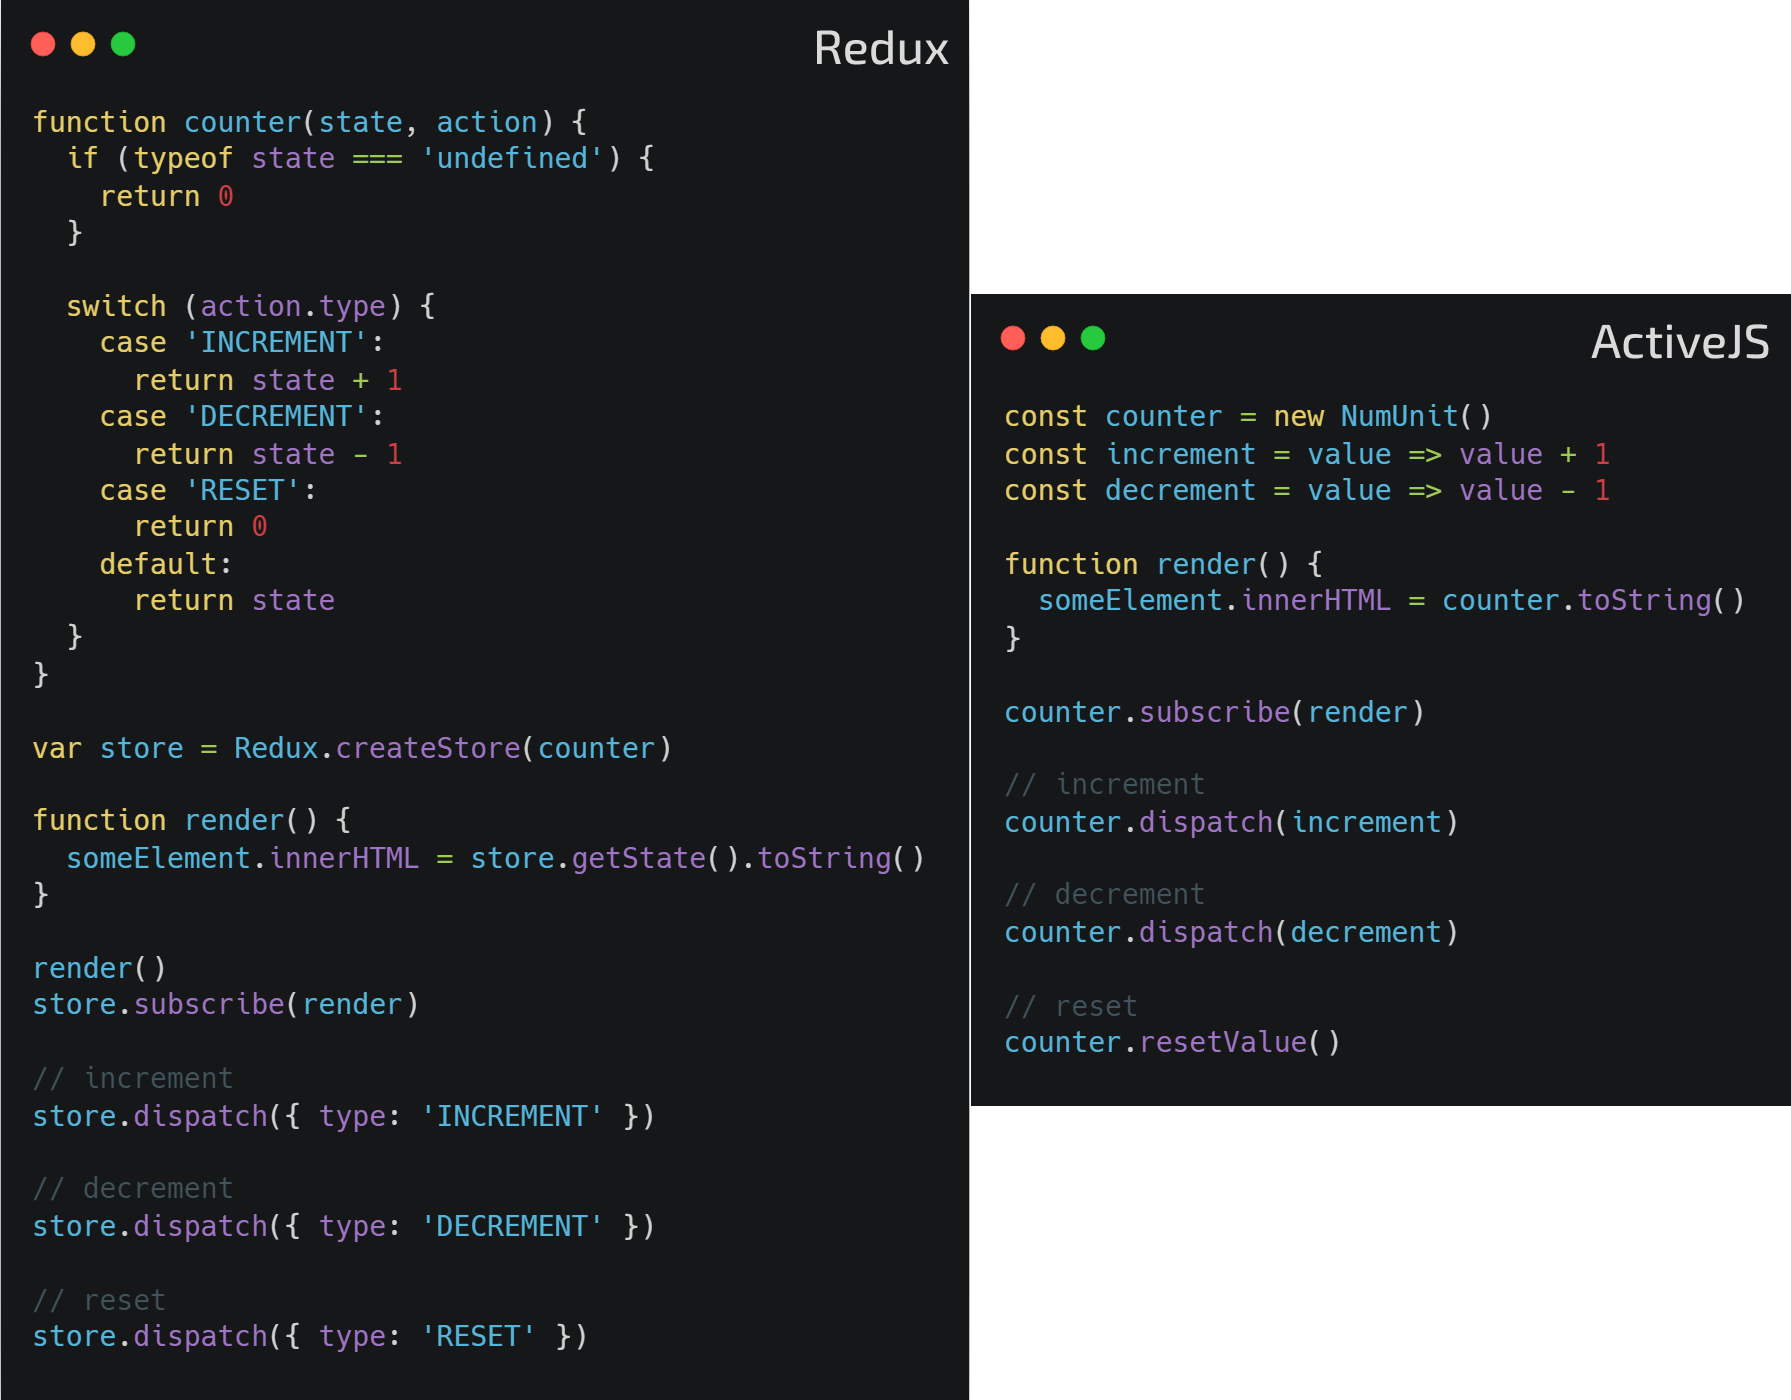
Pragmatic, Reactive State Management for JavaScript Apps
Apache Arrow is a columnar memory layout specification for encoding vectors and table-like containers of flat and nested data. The Arrow spec aligns columnar data in memory to minimize cache misses and take advantage of the latest SIMD (Single input multiple data) and GPU operations on modern processors.
Apache Arrow is the emerging standard for large in-memory columnar data (Spark, Pandas, Drill, Graphistry, ...). By standardizing on a common binary interchange format, big data systems can reduce the costs and friction associated with cross-system communication.

A few different coordinate systems in use in 3D modelling and simulation!
-
When sending your resume, please describe a few of the hardest problems you solved & exactly how you solved them --Elon Musk talks about the resume he wants to see
-
Programmers pursue open-source software, but open-source software depresses the price of the software. The low cost of software reduces programmers' value, which makes many programmers lose their jobs and reduces investors' investment in the software industry. because investors chase profitable places to invest. -The commoditization of software