
CENTER-PIVOT IRRIGATION WAS NOT INVENTED to look pretty. The technology was developed, by a Nebraskan farmer in 1948, as an alternative to the groundwater-irrigation methods that failed to sustain many American farms through the Dust Bowl of the 1930s. These new, elevated pipes radiated out from the centers of fields as far as 133 acres, making it unnecessary to lay and later remove pipes from the ground.
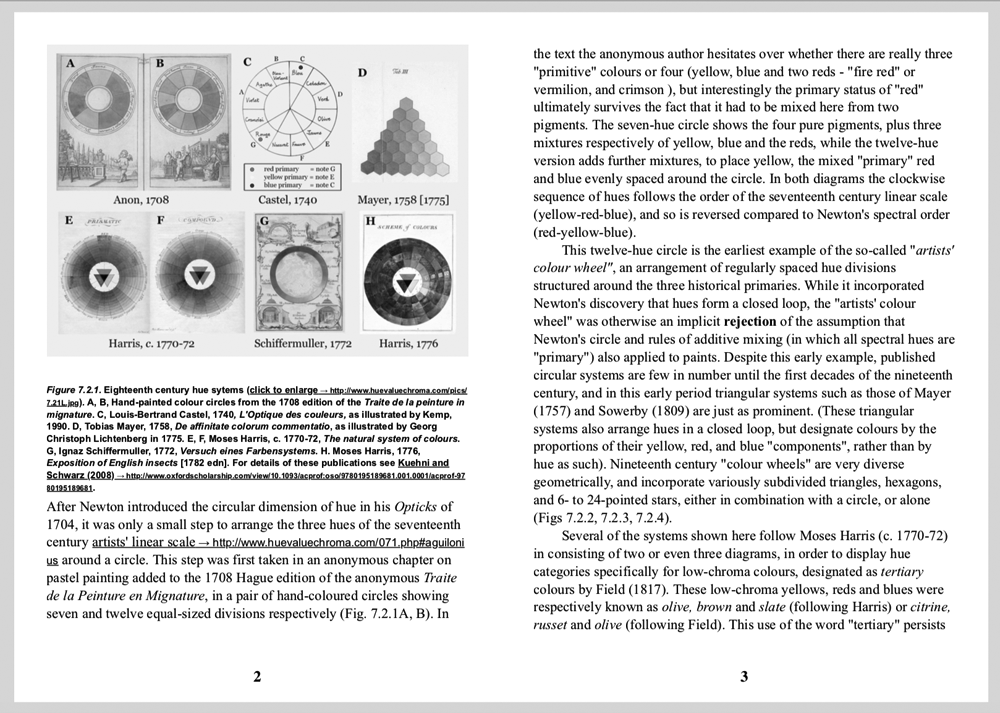
Useful as this new technology proved to be, it also provided an ancillary aesthetic benefit: It has created distinct circles within squares that, when seen from above, look like they belong on the walls of the MoMA. (The circles are the result of the pipes’ inability to reach the outermost acres of the fields; as they spin, they miss the edges and corners.) The architect Ronald Rael, a professor at the University of California, Berkeley, recently launched an Instagram account spotlighting these irrigated circles. Simply called Center Pivot Sprinkler, the account’s images span both the globe and the color wheel, often recalling the painter Piet Mondrian, had he worked with circles rather than squares.

With winter approaching, one concern that reemerges every year is the occurrence of avalanches that can cause large infrastructural damage and loss of life.
GIS and computational specialists have been developing models and methods to better forecast the likelihood of avalanches, including integrating machine learning techniques, while others have used spatial data to understand behavioral choices and avalanche risk.
One recent approach developed uses an ensemble modeling approach that combines statistical and machine learning techniques to develop susceptibility estimates.
The forecasting capabilities of each model combines to create a more dependable forecast that an area may have a forthcoming avalanche. The approach combines belief function (Bel) and probability density (PD) methods with learning models that incorporate multi-layer perceptron (MLP) and logistic regression (LR).
Imagery is then used to create the training set, incorporating 70 potential avalanche regions, and 30 places that are used to validate results. The weighting derived from the Bel and PD techniques are combined with the MLP and LR learning models to generate a susceptibility map for regions.
In all cases, over 90% accuracy was achieved in estimating the susceptibility of given areas to avalanches using historical data

Black Girls M.A.P.P., an employee resource group at Esri, has launched a GIS-powered site called People for the People to provide more voters with the information they need to participate in the upcoming November 3rd election in the United States.
A women-led volunteer advocacy group, People for the People’s focus is to “educate and empower people to be civic-minded using the power of maps and data.” Raynah Kamau, Technical Advisor at Esri notes, “Bringing together members of the GIS community to volunteer their time to build these maps and apps has been an especially rewarding experience and has produced a tool set that I know will help the electorate for many elections to come.”
To help include more voters, People for the People has developed 50 new mapping and data visualization applications that provide resources and information to make informed decisions as well as to encourage more engagement with topics that impact them.
.gif)
Synthetic datasets can inherit flaws in the real-world data they're based on. Startups are working on solutions. Generating synthetic datasets for training machine learning systems is a booming business. Companies that provide such datasets are exploring ways to avoid perpetuating biases in the source data.
Why it matters: Social biases in training datasets often reflect reality. It's true that altering synthetic datasets to change the balance of, say, men and women who earn high incomes is trading one type of bias for another, rather than eliminating it altogether. The aim here is not necessarily to generate accurate data but to produce fair outcomes.
The cost of producing a high-quality training dataset is beyond the reach of some companies, and in situations where sufficient real-world data isn’t available, synthetic data may be the only option. But such datasets can echo and even amplify biases including potentially harmful social biases.
We need data, but more than that, we need to build models that result in fair outcomes.
Create a personal running home page
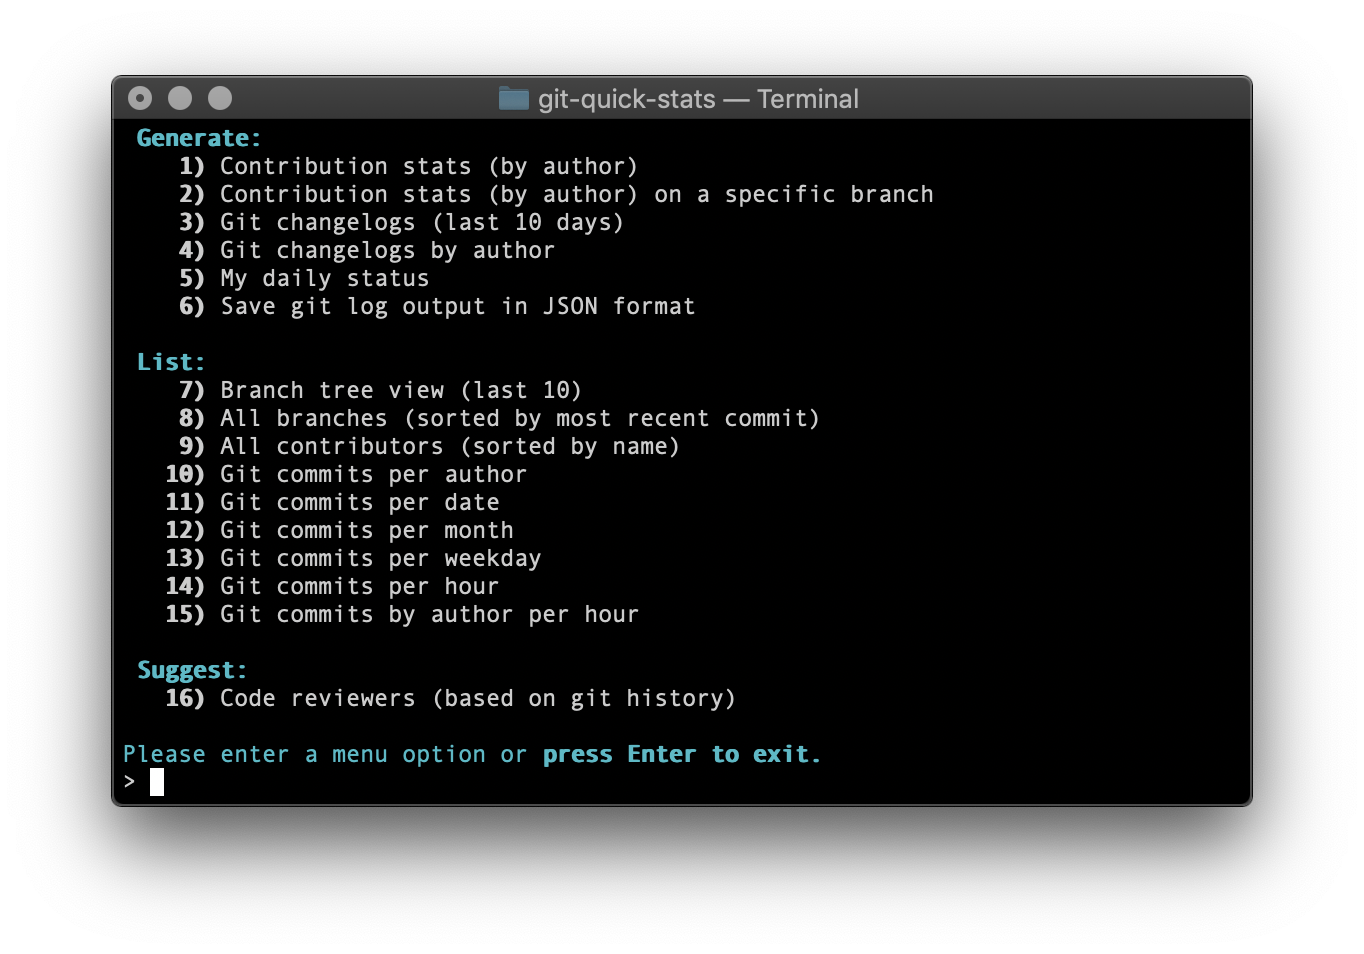
A simple and efficient way to access various statistics in a git repository.

An online tool that converts JS's regular expressions into graphical interpretation(Railroad Diagrams).
Percollate is a command-line tool that turns web pages into beautifully formatted PDF, EPUB, or HTML files.
Pros Helps providing a mobile first user experience
Since mobile apps have rich UIs and are used over slow networks, GraphQL will help you to load only the relevant data without killing the Developer Experience.
Helps you handle complex schema
Since modern UI applications become more and more complex with rich UX using data far away from the REST CRUD based API, GraphQL allows you to combine data from different sources.
Microservices orchestration solution
GraphQL, especially with Apollo Server, provides many features to hide backend complexity from clients.
Give your team a better Developer Experience
GraphQL is not just a new way to query data, it also enhances the way your team (front-mobile/back) will work together.
GraphQL also facilitates the creation of great UX by making loading and dealing with data easier.
Cons Using a technology based on its popularity is not enough
Since a technology solves one or many specific issues, popularity is never sufficient to validate a technology choice.
GraphQL will not solve all your performance issues out the box
GraphQL isn’t a performance optimiser tool, you are still responsible to improve performance.
GraphQL is not REST and will not replace it
GraphQL and REST are two different things and deserve their place in the web technologies world.
GraphQL won’t solve all your problems
GraphQL will help you build rich mobile or web clients.

-
A philosopher once said that the biggest difference between Chinese philosophy and Western philosophy is that Western philosophy is binary logic, pursuing the truth and falsehood of things, and must find out truth and falsehood; Chinese philosophy is ternary logic, which does not pursue truth and falsehood. While advocating abiding by the middle way is the golden mean. My current view is that it can tell whether a person's worldview is mature or profound. --ruanyf
-
Only place in industry that requires a PhD is Data Science. How interesting what you do there is depends on the company. In most cases as a Data Scientist you won't be doing much coding. Otherwise if you want to go in any other software development you don't need PhD, because as you said you don't want to be a researcher. That being said its very likely for your 9-5 programming job to be very boring and not what you expected so I suggest you don't completely rule out researching, because it probably won't get any more interesting than that. --Hacker News reader
-
There is a Marxist theory that the time for Communism would come when interest rates went to zero because the zero percent interest rate was a sign that capitalists no longer had any idea what to do with their money. And there were no good investments left, which is why the interest rates went to zero, and therefore the only thing to do at that point was re-distribute the capital. --Peter Thiel