
The colour of the markers corresponds with the Cost of Living in the city. Red markers show more expensive cities, and green ones show cheaper cities. The size of the markers corresponds with the population of each city. Moving the mouse on top of a city will show its name and the Cost of Living Index of the city.
What is the Cost of Living Index? To calculate each cities' Cost of Living Index value, we start by assigning a value of 100 to a central reference city (that happens to be Prague). Once the reference point has been stablished, the Price Index value of every other city in the database is calculated by comparing their cost of living to the cost of living in Prague. Therefore, if a city has a Price Index of 134, that means that living there is 34% more expensive than living in Prague.
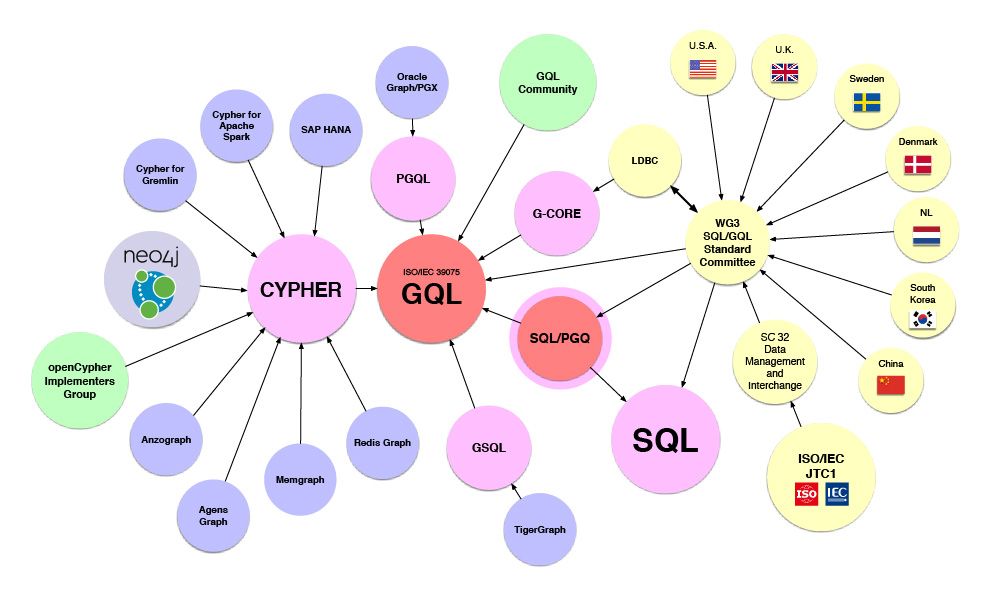
GQL is a new language being developed and maintained by the same international working group that also maintains the SQL standard.
Many vendors, researchers and users agree that graph databases can be developed using non-relational storage and runtime models – a.k.a. native graph technology. Examples include Neo4j's industry-leading graph database platform and the new Redis Labs graph product.
However, they most definitely want a language – like Cypher – that covers the insertion and maintenance of data, and not just data querying. And SQL is unlikely to be the right model for a graph-centric language that can "compose over graphs" (i.e. takes graphs as query inputs and spits out a figure. As a result, the same way SQL can read tables and form result sets which are new tables).
GQL will build on work in openCypher Morpheus, which brings Cypher to Apache Spark. The inspiration of G-CORE from the Linked Data Benchmark Council (LDBC) is to give users a composable graph query language, enabling all of those features.
Combining all three of these streams will make GQL into the conceptual equal of SQL … and then some.
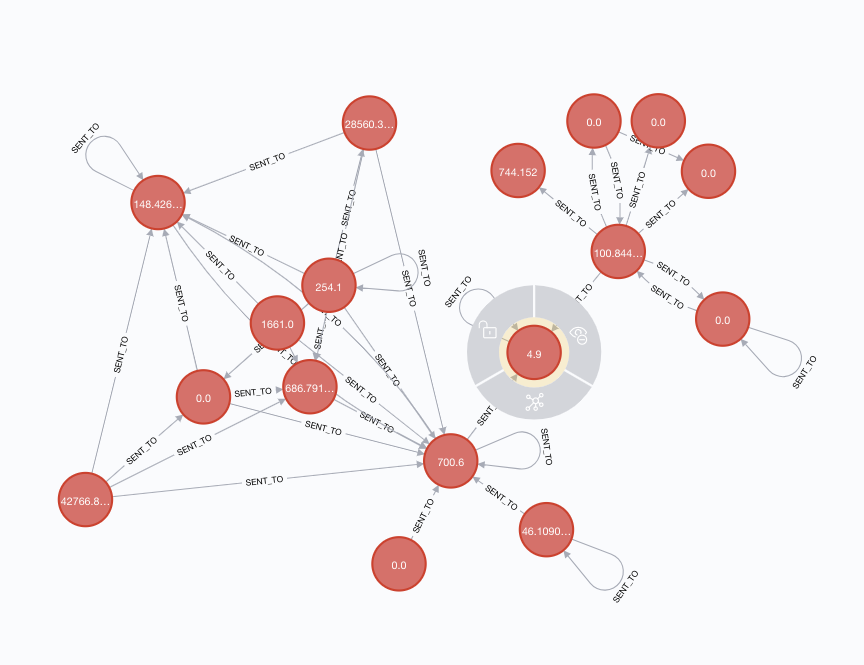
This tutorial explains how to export the data from Lisk relational database to the Neo4j graph database to be able to build and visually explore the blockchain transactions flow graph.

This guide runs through the basic steps for importing the bitcoin blockchain into a Neo4j graph database. It's worth the effort if you're looking to do serious graph analysis on the blockchain. A graph database is a natural fit for bitcoin data, whereas using an SQL database for bitcoin transactions feels like trying to shove a square peg into a round hole.
This book offers guidance and resources for Open Science instructors and trainers, as well as anyone interested in improving transparency and participation in research practices. Supporting and connecting an emerging Open Science community that wishes to pass on its knowledge, the handbook suggests training activities that can be adapted to various settings and target audiences. The book equips trainers with methods, instructions, exemplary training outlines and inspiration for their own Open Science training.
![]()
PostgREST serves a fully RESTful API from any existing PostgreSQL database. It provides a cleaner, more standards-compliant, faster API than you are likely to write from scratch.
Crossfilter is a JavaScript library for exploring large multivariate datasets in the browser. Crossfilter supports speedy (<30ms) interaction with coordinated views, even with datasets containing a million or more records.
Since most interactions only involve a single dimension, and then only small adjustments are made to the filter values, incremental filtering and reducing is significantly faster than starting from scratch. Crossfilter uses sorted indexes (and a few bit-twiddling hacks) to make this possible, dramatically increasing the performance of live histograms and top-K lists.
var flatten = require("flat");

flatten({
  key1: {
    keyA: "valueI",
  },
  key2: {
    keyB: "valueII",
  },
  key3: { a: { b: { c: 2 } } },
});

// {
//   'key1.keyA': 'valueI',
//   'key2.keyB': 'valueII',
//   'key3.a.b.c': 2
// }

unflatten({
  "three.levels.deep": 42,
  "three.levels": {
    nested: true,
  },
});

// {
//     three: {
//         levels: {
//             deep: 42,
//             nested: true
//         }
//     }
// }
Take a nested Javascript object and flatten it, or unflatten an object with delimited keys.
Writing is a customer service problem. Pretend you're sending an email. Sum it up in a tweet.
Investing takes years to learn but improves for a lifetime.

Online SQL Teaching
- When all researchers are aware of Open Science, and are trained, supported and guided at all career stages to practice Open Science, the potential is there to change the way research fundamentally is performed and disseminated, fostering a scientific ecosystem in which research gains increased visibility, is shared more efficiently, and is performed with enhanced research integrity --Open Science Skills Working Group Report