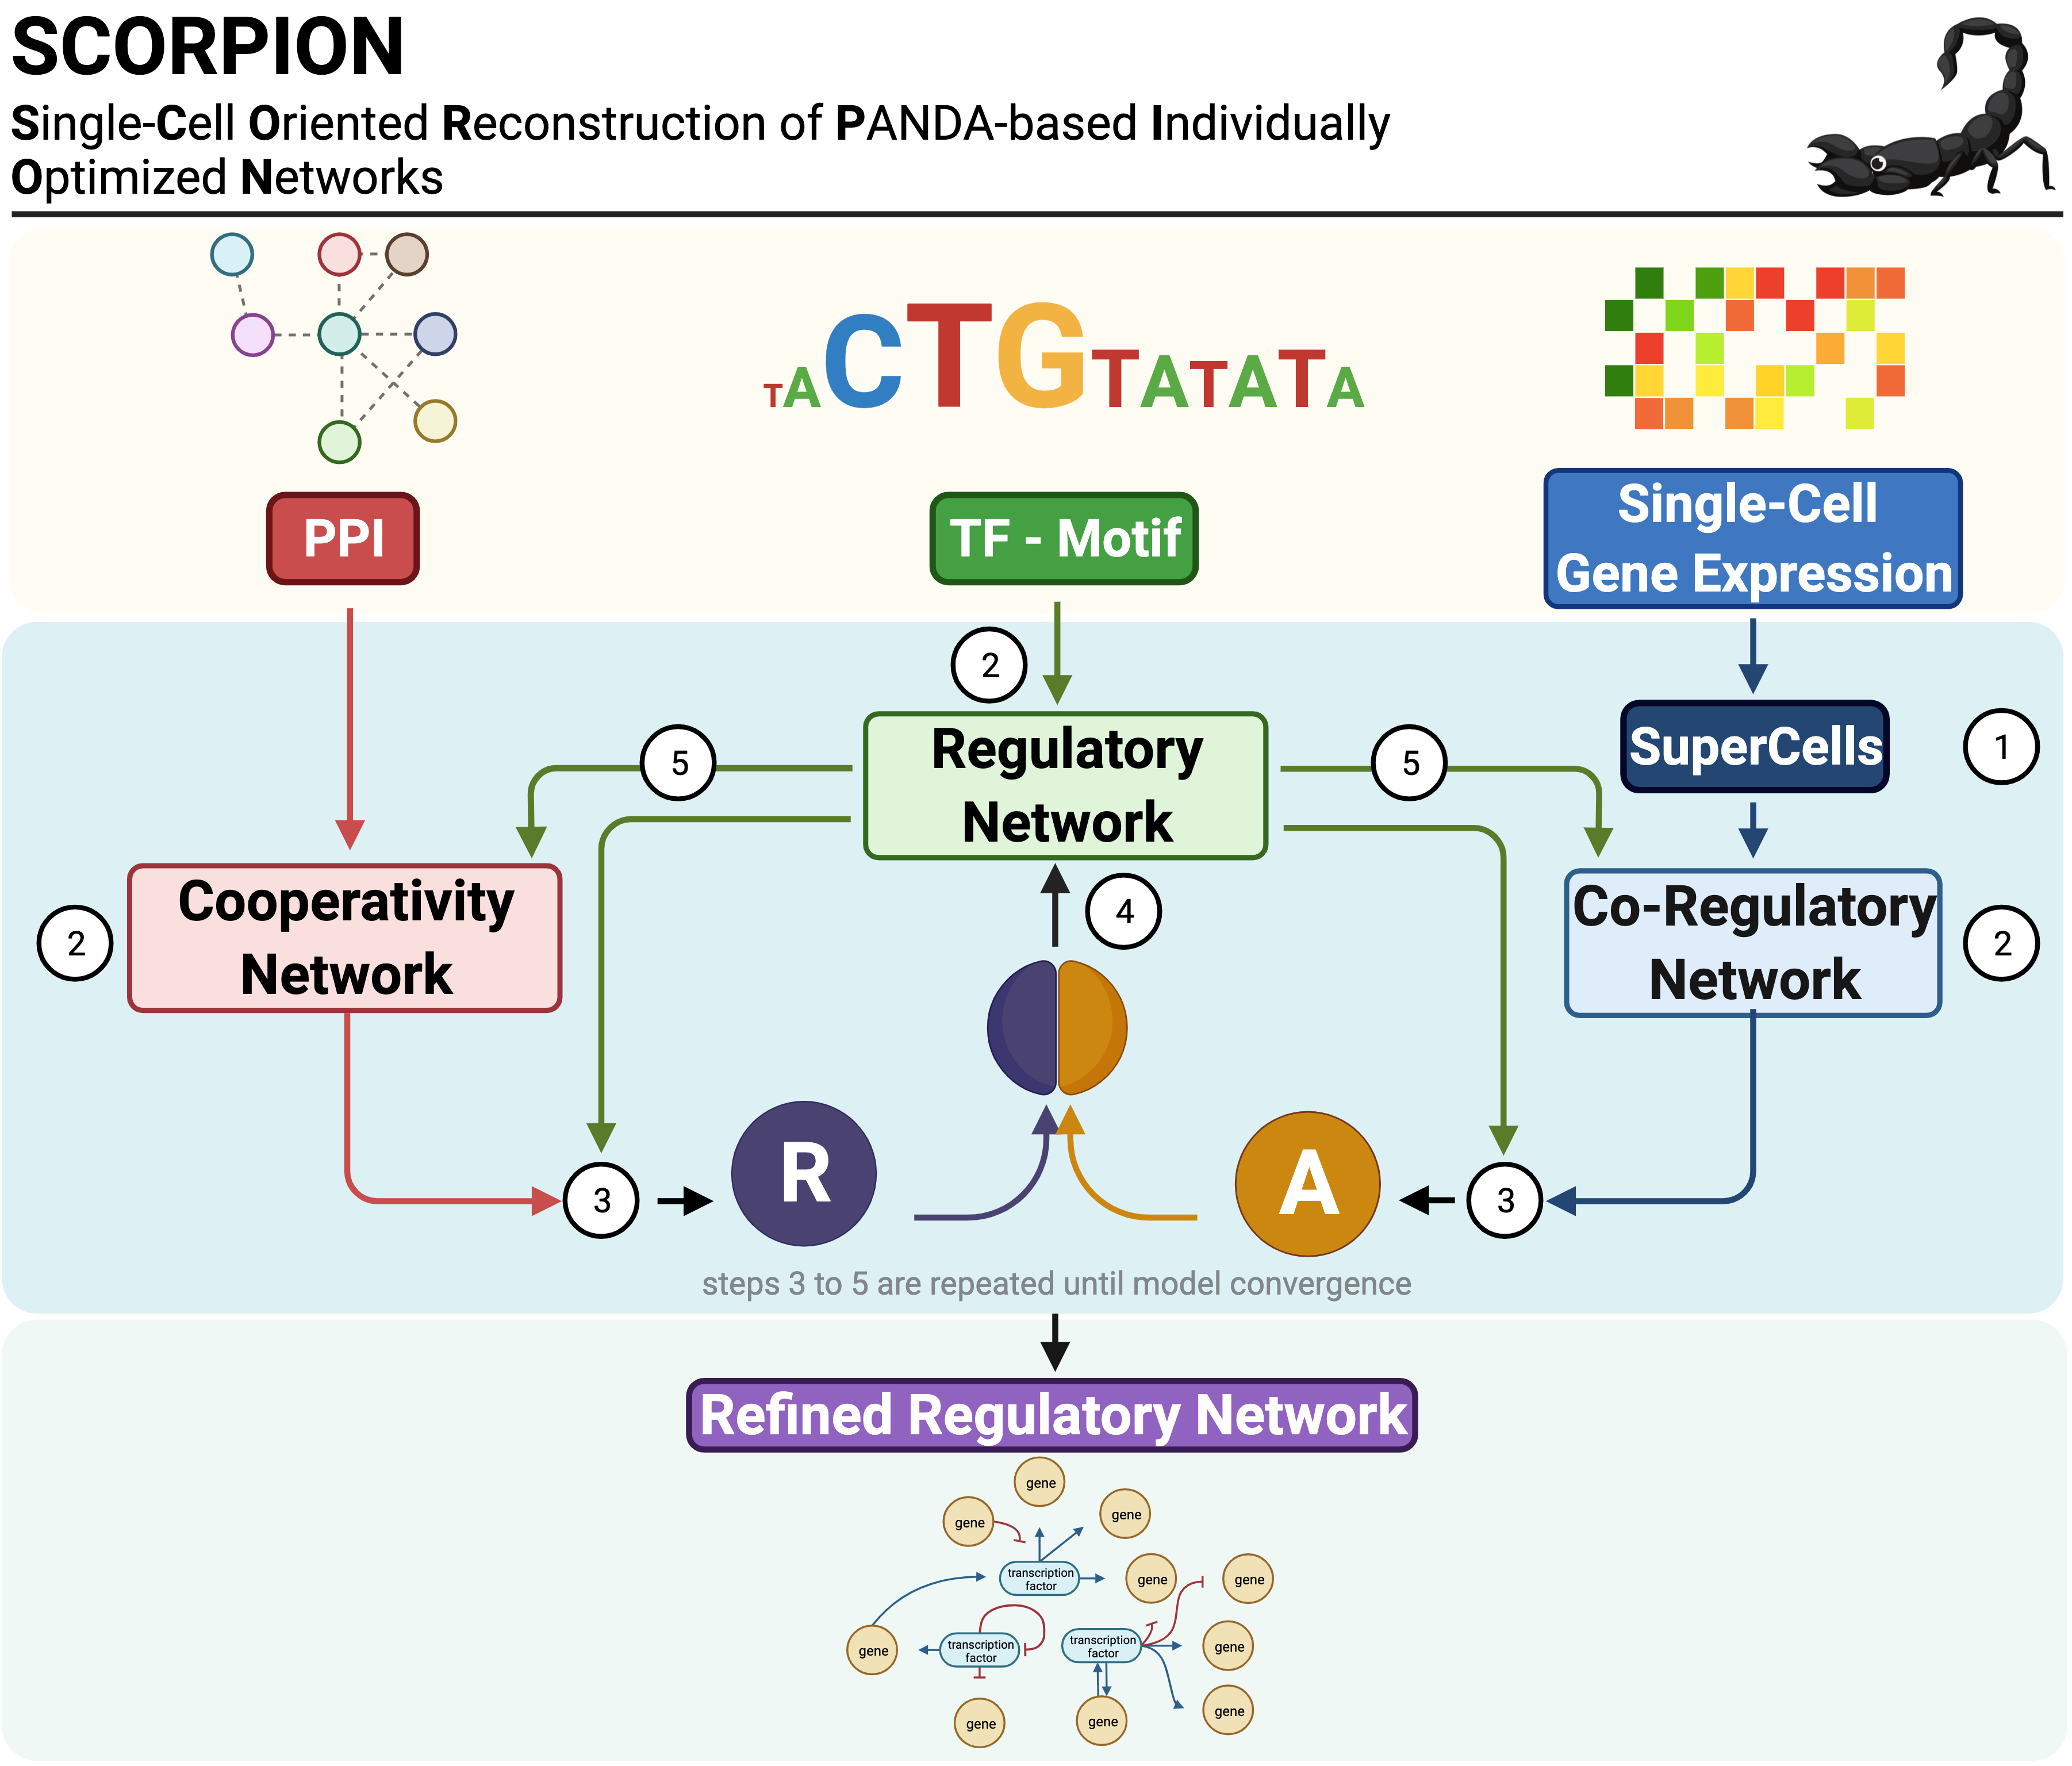
SCORPION (Single-Cell Oriented Reconstruction of PANDA Individually Optimized Gene Regulatory Networks) is an R package for constructing gene regulatory networks from single-cell and single-nucleus RNA sequencing data. The package addresses the sparsity inherent in single-cell expression data through coarse-graining, which aggregates similar cells to improve correlation structure detection. Network reconstruction is performed using the PANDA (Passing Attributes between Networks for Data Assimilation) message-passing algorithm, integrating transcription factor motifs, protein-protein interactions, and gene expression data. By using consistent baseline priors across samples, SCORPION produces comparable, fully-connected, weighted regulatory networks suitable for population-level analyses.
SCORPION is available on CRAN:
install.packages("SCORPION")
library(SCORPION)
To install the development version from GitHub:
devtools::install_github("kuijjerlab/SCORPION")# Load example data
data(scorpionTest)
# Construct a single regulatory network
network <- scorpion(
tfMotifs = scorpionTest$tf,
gexMatrix = scorpionTest$gex,
ppiNet = scorpionTest$ppi
)
# Construct networks stratified by cell groups
networks <- runSCORPION(
gexMatrix = scorpionTest$gex,
tfMotifs = scorpionTest$tf,
ppiNet = scorpionTest$ppi,
cellsMetadata = scorpionTest$metadata,
groupBy = "region"
)The package includes scorpionTest, a dataset containing colorectal cancer single-cell RNA-seq data with the following components:
| Object | Type | Description |
|---|---|---|
gex |
dgCMatrix | Gene expression matrix (300 genes × 1,954 cells) |
tf |
data.frame | Transcription factor-target gene motif pairs from DoRothEA |
ppi |
data.frame | Protein-protein interaction network |
metadata |
data.frame | Cell-level annotations including donor, tissue region, and cell type |
Region codes: T = Tumor, B = Border (adjacent normal), N = Normal
data(scorpionTest)
str(scorpionTest)
View complete data structure
List of 4
$ gex     :Formal class 'dgCMatrix' [package "Matrix"] with 6 slots
  ..@ Dim     : int [1:2] 300 1954
  ..@ Dimnames:List of 2
  .. ..$ : chr [1:300] "IGHM" "IGHG2" "IGLC3" ...
  .. ..$ : chr [1:1954] "P31-T_AAACGGGTCGGTTAAC" ...
$ tf      :'data.frame': 371738 obs. of  3 variables:
  ..$ source_genesymbol: chr [1:371738] "MYC" "SPI1" ...
  ..$ target_genesymbol: chr [1:371738] "TERT" "BGLAP" ...
  ..$ weight           : num [1:371738] 1 1 1 ...
$ ppi     :'data.frame': 4076 obs. of  3 variables:
  ..$ source_genesymbol: chr [1:4076] "ZIC1" "HES5" ...
  ..$ target_genesymbol: chr [1:4076] "ATOH1" "ATOH1" ...
  ..$ weight           : num [1:4076] 1 1 1 ...
$ metadata:'data.frame': 1954 obs. of  4 variables:
  ..$ cell_id  : chr [1:1954] "P31-T_AAACGGGTCGGTTAAC" ...
  ..$ donor    : chr [1:1954] "P31" "P31" ...
  ..$ region   : chr [1:1954] "T" "T" ...
  ..$ cell_type: Factor w/ 1 level "Epithelial": 1 1 ...
Constructs a single gene regulatory network from a gene expression matrix using coarse-graining and the PANDA algorithm.
Usage:
result <- scorpion(
  tfMotifs = NULL,
  gexMatrix,
  ppiNet = NULL,
  computingEngine = "cpu",
  nCores = 1,
  gammaValue = 10,
  nPC = 25,
  assocMethod = "pearson",
  alphaValue = 0.1,
  hammingValue = 0.001,
  nIter = Inf,
  outNet = c("regNet", "coregNet", "coopNet"),
  zScaling = TRUE,
  showProgress = TRUE,
  randomizationMethod = "None",
  scaleByPresent = FALSE,
  filterExpr = FALSE
)
Parameters:
| Parameter | Description | Default |
|---|---|---|
tfMotifs |
Data frame with columns [TF, target gene, motif score]. Pass NULL for co-expression analysis only |
NULL |
gexMatrix |
Expression matrix with genes in rows and cells in columns | Required |
ppiNet |
Data frame with columns [protein1, protein2, interaction score]. Pass NULL to disable PPI integration |
NULL |
computingEngine |
Computation backend: cpu or gpu |
cpu |
nCores |
Number of processors for BLAS/MPI parallel computation | 1 |
gammaValue |
Coarse-graining level; ratio of cells to super-cells | 10 |
nPC |
Number of principal components for kNN network construction | 25 |
assocMethod |
Gene association method: pearson, spearman, or pcNet |
pearson |
alphaValue |
Weight of prior networks relative to expression data (0–1) | 0.1 |
hammingValue |
Convergence threshold based on Hamming distance | 0.001 |
nIter |
Maximum number of PANDA iterations before stopping | Inf |
outNet |
Networks to return: regNet, coregNet, and/or coopNet |
All three |
zScaling |
Return Z-score normalized edge weights; FALSE returns [0,1] scale |
TRUE |
showProgress |
Print progress messages during computation | TRUE |
randomizationMethod |
Randomization for null models: None, within.gene, or by.gene |
None |
scaleByPresent |
Scale correlations by percentage of cells with non-zero expression | FALSE |
filterExpr |
Remove genes with zero expression across all cells before inference | FALSE |
Return value:
A list containing:
| Component | Description |
|---|---|
regNet |
Regulatory network matrix (TFs × target genes) |
coregNet |
Co-regulation network matrix (genes × genes) |
coopNet |
TF cooperation network matrix (TFs × TFs) |
numGenes |
Number of genes in the network |
numTFs |
Number of transcription factors |
numEdges |
Total number of edges in the regulatory network |
Constructs regulatory networks for multiple cell groups defined by metadata columns. This function wraps scorpion() to enable stratified network inference and returns results in a format suitable for comparative analysis.
Usage:
networks <- runSCORPION(
  gexMatrix,
  tfMotifs,
  ppiNet,
  cellsMetadata,
  groupBy,
  normalizeData = TRUE,
  removeBatchEffect = FALSE,
  batch = NULL,
  minCells = 30,
  ...
)
Parameters:
| Parameter | Description | Default |
|---|---|---|
gexMatrix |
Expression matrix with genes in rows and cells in columns | Required |
tfMotifs |
Data frame with columns [TF, target gene, motif score] | Required |
ppiNet |
Data frame with columns [protein1, protein2, interaction score] | Required |
cellsMetadata |
Data frame with cell-level metadata; must contain columns specified in groupBy |
Required |
groupBy |
Character vector of column name(s) in cellsMetadata for stratification |
Required |
normalizeData |
Apply log normalization to expression data before network inference | TRUE |
removeBatchEffect |
Perform batch effect correction before network inference | FALSE |
batch |
Factor or vector giving batch assignment for each cell; required if removeBatchEffect = TRUE |
NULL |
minCells |
Minimum number of cells required per group to build a network | 30 |
... |
Additional parameters passed to scorpion() (see above) |
— |
Return value:
A data frame in wide format where:
- Rows represent TF-target pairs
- Columns represent network identifiers (derived from
groupByvalues) - Values are edge weights from each network
Example output:
| tf | target | P31--T | P31--B | P31--N | P32--T | ... |
|---|---|---|---|---|---|---|
| AATF | ACKR1 | -0.326 | -0.337 | -0.344 | -0.298 | ... |
| ABL1 | ACKR1 | -0.340 | -0.339 | -0.351 | -0.312 | ... |
Examples:
# Stratify by tissue region
nets_by_region <- runSCORPION(
  gexMatrix = scorpionTest$gex,
  tfMotifs = scorpionTest$tf,
  ppiNet = scorpionTest$ppi,
  cellsMetadata = scorpionTest$metadata,
  groupBy = "region"
)

# Stratify by multiple variables
nets_by_donor_region <- runSCORPION(
  gexMatrix = scorpionTest$gex,
  tfMotifs = scorpionTest$tf,
  ppiNet = scorpionTest$ppi,
  cellsMetadata = scorpionTest$metadata,
  groupBy = c("donor", "region")
)

# With batch effect correction
nets_corrected <- runSCORPION(
  gexMatrix = scorpionTest$gex,
  tfMotifs = scorpionTest$tf,
  ppiNet = scorpionTest$ppi,
  cellsMetadata = scorpionTest$metadata,
  groupBy = "region",
  removeBatchEffect = TRUE,
  batch = scorpionTest$metadata$donor
)Performs statistical testing on network edges to identify differential regulatory relationships between groups. The function supports single-sample tests, two-sample comparisons, and paired tests. All computations are fully vectorized for efficiency with large-scale datasets.
Usage:
results <- testEdges(
  networksDF,
  testType = c("single", "two.sample"),
  group1,
  group2 = NULL,
  paired = FALSE,
  alternative = "two.sided",
  padjustMethod = "BH",
  minMeanEdge = 0
)
Parameters:
| Parameter | Description | Default |
|---|---|---|
networksDF |
Output from runSCORPION() |
Required |
testType |
Test type: single (one-sample) or two.sample |
Required |
group1 |
Column names for the first (or only) group | Required |
group2 |
Column names for the second group (two-sample tests) | NULL |
paired |
Perform paired t-test; requires equal-length groups in matched order | FALSE |
alternative |
Alternative hypothesis: two.sided, greater, or less |
two.sided |
padjustMethod |
Multiple testing correction method (see p.adjust) |
BH |
minMeanEdge |
Minimum mean absolute edge weight for inclusion | 0 |
Return value:
A data frame containing:
| Column | Description |
|---|---|
tf, target |
TF-target pair identifiers |
meanEdge |
Mean edge weight (single-sample) |
meanGroup1, meanGroup2 |
Group means (two-sample) |
diffMean |
Difference in means, Group1 − Group2 (two-sample) |
log2FoldChange |
Log2 fold change (two-sample) |
tStatistic |
t-statistic |
pValue |
Raw p-value |
pAdj |
Adjusted p-value |
Examples:
# Build networks stratified by donor and region
nets <- runSCORPION(
  gexMatrix = scorpionTest$gex,
  tfMotifs = scorpionTest$tf,
  ppiNet = scorpionTest$ppi,
  cellsMetadata = scorpionTest$metadata,
  groupBy = c("donor", "region")
)

# Define groups
tumor_nets <- grep("--T$", colnames(nets), value = TRUE)
normal_nets <- grep("--N$", colnames(nets), value = TRUE)

# Two-sample comparison: Tumor vs Normal
results <- testEdges(
  networksDF = nets,
  testType = "two.sample",
  group1 = tumor_nets,
  group2 = normal_nets
)

# Paired test for matched samples (same patient)
tumor_ordered <- c("P31--T", "P32--T", "P33--T")
normal_ordered <- c("P31--N", "P32--N", "P33--N")

results_paired <- testEdges(
  networksDF = nets,
  testType = "two.sample",
  group1 = tumor_ordered,
  group2 = normal_ordered,
  paired = TRUE
)

# Single-sample test: edges differing from zero
results_single <- testEdges(
  networksDF = nets,
  testType = "single",
  group1 = tumor_nets
)Performs linear regression to identify edges with significant trends across ordered conditions. This is useful for studying disease progression or developmental trajectories.
Usage:
results <- regressEdges(
  networksDF,
  orderedGroups,
  padjustMethod = "BH",
  minMeanEdge = 0
)
Parameters:
| Parameter | Description | Default |
|---|---|---|
networksDF |
Output from runSCORPION() |
Required |
orderedGroups |
Named list of column name vectors; list order defines progression | Required |
padjustMethod |
Multiple testing correction method | BH |
minMeanEdge |
Minimum mean absolute edge weight for inclusion | 0 |
Return value:
A data frame containing:
| Column | Description |
|---|---|
tf, target |
TF-target pair identifiers |
slope |
Regression slope (change per condition step) |
intercept |
Regression intercept |
rSquared |
Coefficient of determination |
fStatistic |
F-statistic for the regression |
pValue |
Raw p-value |
pAdj |
Adjusted p-value |
meanEdge |
Overall mean edge weight |
mean<Condition> |
Mean edge weight for each condition |
Example:
# Define ordered progression: Normal → Border → Tumor
ordered_conditions <- list(
  Normal = grep("--N$", colnames(nets), value = TRUE),
  Border = grep("--B$", colnames(nets), value = TRUE),
  Tumor = grep("--T$", colnames(nets), value = TRUE)
)

# Identify edges with significant trends
results_reg <- regressEdges(
  networksDF = nets,
  orderedGroups = ordered_conditions
)

# Edges increasing along progression
increasing <- results_reg[results_reg$pAdj < 0.05 & results_reg$slope > 0, ]

# Edges decreasing along progression
decreasing <- results_reg[results_reg$pAdj < 0.05 & results_reg$slope < 0, ]If you use SCORPION in your research, please cite:
Osorio, D., Capasso, A., Eckhardt, S.G. et al. Population-level comparisons of gene regulatory networks modeled on high-throughput single-cell transcriptomics data. Nature Computational Science 4, 237–250 (2024). https://doi.org/10.1038/s43588-024-00597-5
- Supplementary Materials: https://github.com/dosorio/SCORPION/
- Issue Tracker: https://github.com/kuijjerlab/SCORPION/issues
- CRAN Package Page: https://cran.r-project.org/package=SCORPION