A Python extension for Gloodata that provides advanced business analytics and dashboards using the classic database for a company called “Northwind Traders” which imports and exports specialty foods from around the world (MySQL version).
-
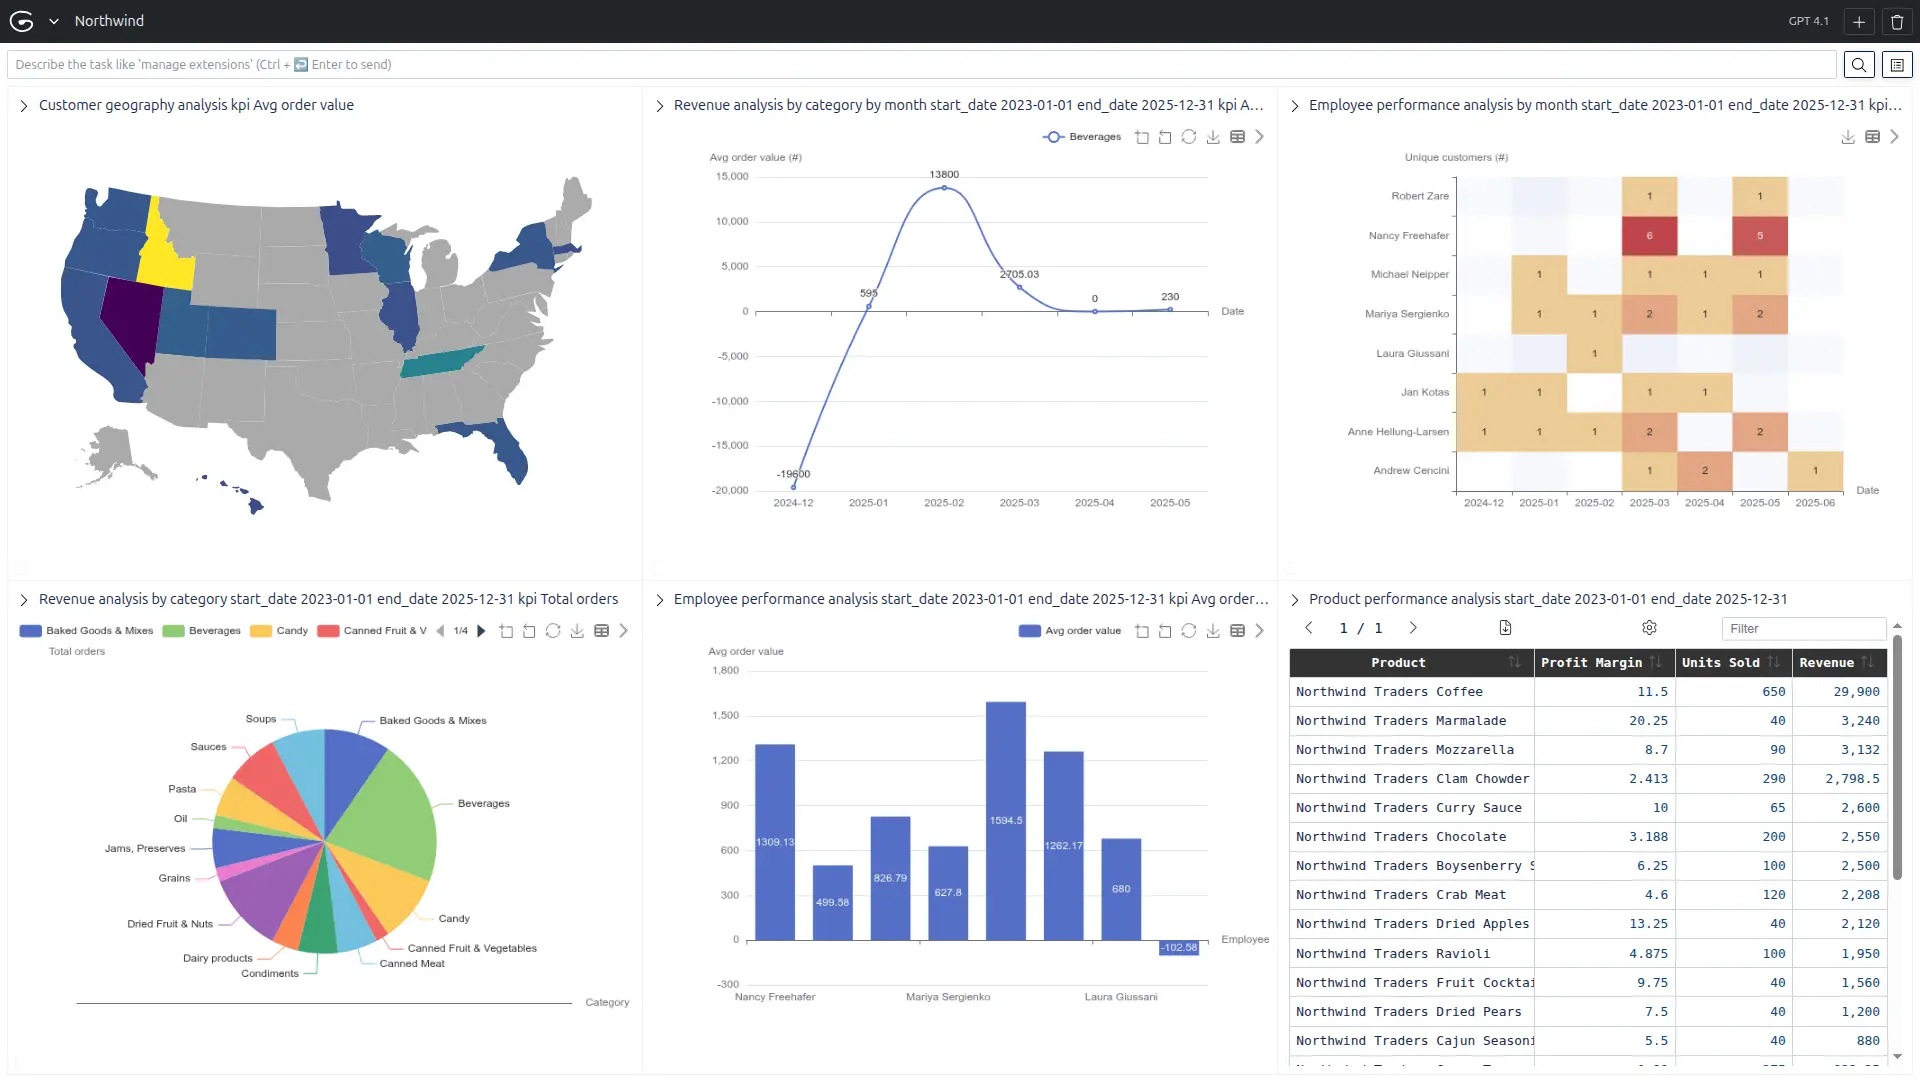
📊 Analytics Tools
-
Revenue by Category Analysis
Bar chart showing sales performance by product category. Total for a period and by month. -
Employee Performance Dashboard
Rankings and metrics for sales team performance. Total for a period and by month. -
Customer Geography Analysis
Geographic distribution and regional performance. -
Product Performance Analysis
Detailed table with profitability insights. -
Shipping Performance Analysis
Carrier comparison and delivery efficiency. -
Customer Loyalty Analysis
Customer segmentation and lifetime value. -
Purchase Order Efficiency
Supplier performance and procurement metrics. -
Inventory Movement Analysis
Stock transaction patterns and management. -
Order Fulfillment Dashboard
Processing efficiency and status tracking.
-
-
🎯 Smart Filtering System
Each function supports multiple filters for dynamic analysis:- Date ranges for time-based analysis
- Geographic filters (state/province)
- Category/product filters for focused analysis
- Status filters for operational insights
- Employee/supplier filters for performance tracking
-
📈 Diverse Visualization Types
- Bar charts for comparisons
- Line charts for trends
- Pie charts for distributions
- Stacked charts for multi-dimensional data
- Tables for detailed data exploration
-
🔍 Business Intelligence Focus
The queries answer critical business questions like:- Which product categories drive the most revenue?
- Who are our top-performing employees?
- What are our seasonal sales patterns?
- Which customers are most valuable?
- How efficient is our shipping?
- Which suppliers perform best?
- What's our order fulfillment rate?
Check that you are in a recent version of uv:
uv self update-
Clone the repository:
git clone https://github.com/gloodata/extension-northwind.git cd extension-northwind -
Start Northwind MySQL docker database
docker run --platform linux/amd64 -d -p 3307:3306 --name northwind -e MYSQL_ROOT_PASSWORD=supersecret manchestercodes/northwind -
Optional - Update database dates The script updates historical dates in the database so that the intervals between dates are preserved, but shifted to align with the current date. This ensures that the relative distribution and spacing of the original dates remain consistent in the updated data.
docker exec -i northwind mysql -uroot -psupersecret northwind < update_dates.sql -
Optional - Configure MySQL connection:
Set the following environment variables as needed. Not needed if you run the Northwind database as indicated in step #2:MYSQL_HOST(default:localhost)MYSQL_PORT(default:3307)MYSQL_USER(default:root)MYSQL_PASSWORDMYSQL_DATABASE(default:northwind)
-
Run the extension:
uv run src/main.py --host 127.0.0.1 --port 8887
Bar chart showing total revenue, order count or avg order value by product category.
- "Total revenue by category since the year 2000",
- "Order count by product category",
- "Average order value by category",
Tool: revenue_by_category
Query: revenue_by_category
Chart: pie when kpi is total orders, else bar
Bar chart showing total revenue, order count or avg order value by product category by month
- "Total revenue by category by month since covid pandemic up to today"
- "Order count by product category by month in last 2 years"
- "Average order value by category by month"
Tool: revenue_by_category_by_month
Query: revenue_by_category_by_month
Chart: line
Rankings and metrics for sales team.
- "Total revenue by employee"
- "Order count by employee"
- "Unique customers by employee"
- "Average order value by employee"
Tool: employee_performance
Query: employee_performance
Chart: bar
Rankings and metrics for sales team by month.
- "Total revenue by employee since 2000"
- "Order count by employee in last year"
- "Unique customers by employee"
- "Average order value by employee"
Tool: employee_performance_by_month
Query: employee_performance_by_month
Chart: heatmap
Map or table of customer locations and sales.
- "Customer geography analysis"
- "Sales by region"
Tool: customer_geography_analysis
Query: customer_geography_analysis
Chart: areamap with map usa
Detailed table with profitability and sales.
- "Product performance table"
- "Best selling products"
Tool: product_performance_analysis
Query: product_performance
Chart: table
The following tools are not yet implemented, but we suggest function names and provide ready-to-use queries. Each query computes multiple KPIs — you must specify which one is being used when returning the chart:
Carrier comparison and delivery efficiency.
- "Shipping performance"
- "Carrier delivery times"
Tool: shipping_performance_analysis
Query: shipping_performance_analysis
Customer segmentation and value.
- "Customer loyalty analysis"
- "Top repeat customers"
Tool: customer_loyalty_analysis
Query: customer_loyalty_analysis
Supplier performance and procurement metrics.
- "Supplier performance"
- "Purchase order efficiency"
Tool: purchase_order_efficiency
Query: purchase_order_efficiency
Stock transaction patterns.
- "Inventory movement"
- "Stock changes over time"
Tool: inventory_movement_analysis
Query: inventory_movement_analysis
Order processing efficiency and status.
- "Order fulfillment dashboard"
- "Order status tracking"
Tool: order_fulfillment_analysis
Query: order_fulfillment_analysis
Files you may want to check first:
extension-northwind/
├── src/
│   └── toolbox.py          # Main extension logic
├── queries.sql             # SQL queries for analytics
└── resources/              # Images and static assets
- Define new SQL queries in
queries.sql - Create tool functions in
src/toolbox.pyusing the@tb.tooldecorator - Specify visualization types and parameters in the return dictionary
- Python
- MySQL
- uv
- Northwind sample database (MySQL version)
This project is open source and available under the MIT License.
For questions, issues, or contributions, please open an issue on GitHub or contact the maintainers.