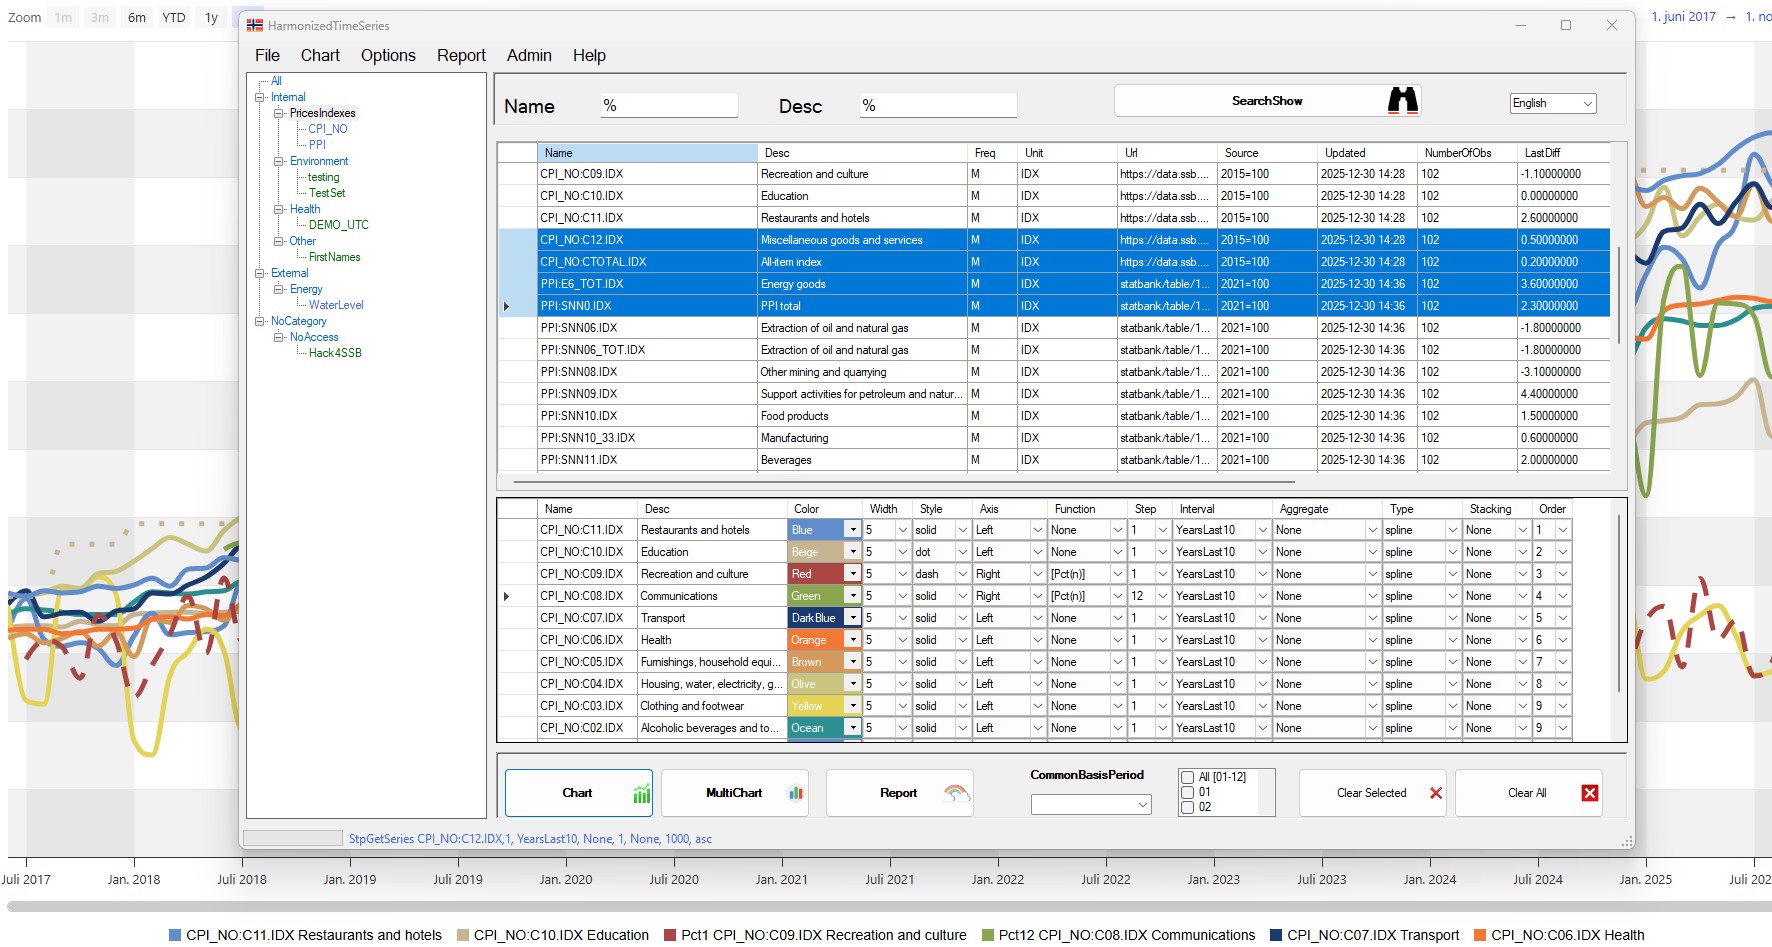
Harmonize is a time-series data platform designed to store, manage, and visualize datasets with different frequencies and base years — without requiring programming skills — while also helping analysts and management save time.
The system enables analysts and non-technical users to:
• Store time series from multiple domains in a unified format
• Compare datasets with different base years and frequencies
• Generate charts and reports without programming
• Integrate with Python and R for advanced analysis
Architecture:
- Database: Microsoft SQL Server
- Desktop UI: C# Windows application
- APIs: Python and R, works with powerBI (not recomended)
- Charts: Highcharts
Harmonize is designed for organizations that need to store, share, and analyze time series data across multiple domains. Typical use cases include data related to environment, prices, health, employment, power, energy, and other statistical or operational datasets.
The system is especially well suited for organizations that want to centralize data from different sources, make it accessible to users with varying technical skills, and enable consistent analysis and comparison across domains and time frequencies.
The alternative to Horizon is to develop something unique for each statistical domain, and get spend a lot of time doing this, ending up with a system where you cannot compare, and yo need programmer skills to use, basically you will need to ask developers to get the data for you, and you end up with different formats in excel..
┌──────────────────────────────────────────────────────────────────────────┐
│                 CLIENT and USER LAYER                                    │
│                                                                          │
│  C# Harmonize app     Python        R          Excel Addin               │
│  - Visualization    - ETL         - Analysis   -Read                     │
│  - Highcharts       - Upserts     - Models     -Update                   │
│  --Ad-hoc analysis                             -Ad-hoc analysis          │
└───────────────┬───────────────┬──────────────────────────────────────────┘
                │               │
                │ calls stored procedures
                │
┌───────────────v─────────────────────────────┐
│      STORED PROCEDURE API  (main ones)      │
│                                             │
│  GetSeris                                   │
│  PutTime                                    │
│  Create Datasets                            │
│  Update Statistics                          │
│  Delete Time Series / Datasets              │
│                                             │
│  Centralized validation & business logic    │
│                                             │
└───────────────────────┬─────────────────────┘
                        │
                        │
┌───────────────────────v─────────────────────┐
│                DATA LAYER                   │
│                                             │
│            Microsoft SQL Server             │
│                                             │
│  Tables:                                    │
│  - Loadset                                  │
│  - Timeseries                               │
│  - Observations                             │
│                                             │
│  Time series using converions stored in UTC │
│                                             │
└─────────────────────────────────────────────┘
- Install Microsoft SQL Server. (only if you do not have one already)
- Restore the Harmonize database:
RESTORE DATABASE Harmonize
FROM DISK = 'Harmonize.bak'
- Open the C# solution in Visual Studio.
- Build and run the application. (possible to use already compiled ) To test drive Harmonize with a testdatabase in cloud see downloads at www.Harmonize.com
Python examples are available in the Python/ directory.
- Microsoft SQL Server
- Database model:
Harmonize.sql - Backup file:
Harmonize.bak
These ensure the Harmonize database is available and correctly configured.
- Windows C# application for visualization and interaction
- Requires Visual Studio to compile and build
- Not required, but significantly improves usability
- Python installation required for API interaction
- Python samples are available in the
Python/directory - Used for:
- Uploading / upserting new datasets
- Extracting data for further calculations (e.g., seasonal adjustment)
- Writing processed data back into the database
- Similar workflows apply for R
-- Stored procedures available from Python / R and MSSQL Database
- Create loadset
- PutTime :Update or Inserts date to existing series, or create new series if not already exists
- Update statistics : Number of observations, first and last observations, updated time etc
- Delete loadsets
- Delete Data on a timeseries
- Delete a timeseries and its data
- Store time series with different frequencies (weekly, monthly, quarterly, annual)
- Seamless comparison of datasets with different base years
(e.g.2015=100vs2020=100) - Use of datetime formats enables zoomable and scrollable charts
- Aggregations:
avg_quarteravg_year
- Functions:
diff_npct_1,pct_2, …pct_n(lag-based calculations)
- Chart a quarterly index together with a monthly index
- Correctly add weekly, monthly, quarterly, and annual series
- Use a common base year or base period, even if datasets differ
- Chart
- MultiChart
- YearChart
(available under the Chart menu)
- User Report button for quick:
- Horizontal reports
- Vertical reports
- Report tables available directly inside charts
- Number of decimals and datatime format can be chosen from the Harmonize and template
- Users can save and retrieve series selections
- Saved selections are automatically repopulated with fresh data (if available)
- Supports both:
- Dynamic intervals (e.g. always current year)
- Static intervals (e.g. always showing data up to 2025)
- Templates can be modified (optional)
- Customize:
- Fonts
- Colors - can also be selected from harmonize app
- Legends
- Tooltips
- Modify
Harmonize.cssto match your design standards - The templates takes a file as arguments and could easily be used for a simple web site:
- Charts used at web is demonstrated at www.Harmonize.no
- Harmonize let you save datafiles in custom names to be used by the templates on your web site
- what you need is then just to copy / move newer datafiles to your web- when it already has the templates
- Uses Highcharts by default
- Can be replaced with other compatible JavaScript charting libraries
(not recommended)
- The C# application overwrites
MyData.jseach time charts are generated- Copy it elsewhere if you need to preserve the data
- You may:
- Copy and modify
Chart.htmltemplates - Create your own HTML templates
- Fully customize all HTML files
- Copy and modify
- Only use intervals containing data up to one year
- Examples:
CurrentYear-1,CurrentYear-2
- Examples:
- Additional intervals can be added in the database
Harmonize supports high-frequency data (e.g. hourly) and correctly handles summer and winter time changes.
- Data must be stored in UTC
- Each dataset can be configured (in the
Loadsettable) to display in a different time zone
- Time zones affect not only visualization, but also aggregation logic
- The system converts time zones before applying functions and aggregations
- Hourly spot prices:
- 25 observations when switching to winter time
- 23 observations when switching to summer time
- Charts may show two observations at 02:00 once per year when CET clocks are set back
- The user interface supports multiple languages
- Users can:
- Change translations themselves
- Add new languages as needed
- Harmonize currently has English, Norwegian, Ukrainian, Albanian, Hindi and Arabic do demonstrate the functionality
Harmonize provides a powerful yet user-friendly platform for:
- Managing time series data
- Comparing datasets across frequencies and base years
- Generating interactive charts and reports
- Integrating with Python and R for advanced analytics, updates and downloads
- Integrating with XLSAddIn (read & update) and save as csv options
- Harmonize can save / retrieve selections and populate with fresh data later
- Harmonize can delete and upload data on a dataset if user is configured with write-access
- The system has configurable access control and logging
It is suitable for analysts, managers, and non-programmers & programmers alike.