Home
Welcome to the gnuplot_utilities wiki!
This repository contains some scripts that can simplify and accelerate some tasks with gnuplot that are important for the daily use with gnuplot:
- gp_size_calculator: Calculate the height of a plot with givend width and vice versa
- gp_fixed_sizes: Place several plots side-by-side in multiplot mode with full control over size and margins.
- gp_subplot_labels: Mark the suplots of a multiplot with some letter for easy referencing
- gp_read_value: Extract single values from files and store them in a variable that can be used for plotting
The scripts are just text files. So clone this git-repository into a directory you want or just download the files as a tar.gz or .zip and extract them to a folder of your choice.
There are two possibilities to make gnuplot search for the script files in the correct directory. The first one is to set the loadpath directly in the plot script by using set loadpath '/path/to/scripts'. The other possibility is to specify the path in the environmental variable GNUPLOT_LIB.
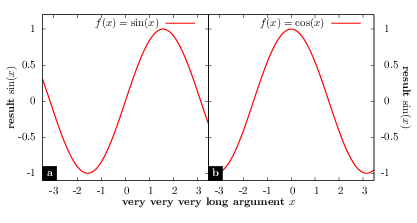
Here we give an example how to produce the following picture using the terminal epslatex. The plot script and the Makefile can be found in the examples directory.
###########################################
# General settings                        #
# Can be put in a config file to generate #
# several plots with the same appereance  #
###########################################

# Needed for evaluating strings with @
set macros

# Value of the margins in cm
margin_left = 1.5
margin_right = 1.5
margin_bottom = 1.5
margin_top = 0.5

# Calculate the height of the plot
call "../gp_size_calculator.gp"
plot_width = 14.7
plot_height = gpsc_fixed_width(plot_width, 2, margin_left, margin_right, margin_bottom, margin_top)
plot_size = sprintf("%g",plot_width)."cm,".sprintf("%g",plot_height)."cm"

# Call the script setting fixed sizes with units
call "../gp_fixed_sizes.gp" plot_width plot_height 2 1 margin_left margin_right margin_bottom margin_top

# Load the script for the subplot labels
load "../gp_subplot_labels.gp"

# Set the terminal with an explicit size matching your requirements
set terminal epslatex standalone color colortext size @plot_size
set output "example_2_1.tex"

set multiplot

##########
# Plot 1 #
##########

reset

# Set the margins to 0
@gpfs_set_margins;
# Set the sizes of the plot
set size gpfs_size_x,gpfs_size_y
# Plot is the first in x-direction and the first in y-direction
set origin gpfs_origin_x(0),gpfs_origin_y(0)

set xrange [-1.1*pi:1.1*pi]
set yrange [-1.1:1.2]

# Use the functions to manually set the x- and the y-labels
set label '\textbf{very very very long argument} $x$' at screen gpfs_label_x1_x(0.5), gpfs_label_x1_y(0) center
set label '\textbf{result} $\sin(x)$' at screen gpfs_label_y1_x(0) - 0.025, gpfs_label_y1_y(0) center rotate by 90

# Set the subplot label
sp_label = gpsl_bottom_left('$\textbf{a}$', 0.5, 0); eval sp_label

plot sin(x) title '$f(x) = \sin(x)$' lw 4


##########
# Plot 2 #
##########

reset

# Set the margins to 0
set lmargin 0; set rmargin 0; set tmargin 0; set bmargin 0;
# Set the sizes of the plot
set size gpfs_size_x,gpfs_size_y
# Plot is the second in x-direction and the first in y-direction
set origin gpfs_origin_x(1),gpfs_origin_y(0)

set xrange [-1.1*pi:1.1*pi]
set yrange [-1.1:1.2]
set y2range [-1.1:1.2]

set format y ''
set y2tics -1.5,0.5,1.5

set label '\textbf{result} $\cos(x)$' at screen gpfs_label_y2_x(1) + 0.025, gpfs_label_y2_y(0) center rotate by 270

sp_label = gpsl_bottom_left('$\textbf{b}$', 0.5, 0); eval sp_label

plot cos(x) title '$f(x) = \cos(x)$' lw 4