
An oversampling technique for imbalanced regression datasets.
Use the below command to install:
pip install knnor-regThe folder knnor_reg contains the source code.
Convert your dataset to a numpy array. All values of the data must be numeric. The last column must be the target value.
Example implementation using artificial data:
import matplotlib.pyplot as plt
import numpy as np
from sklearn.datasets import make_regression
from knnor_reg import data_augment

# Generate regression data using make_regression
X, y = make_regression(n_samples=1000, n_features=10, noise=0.1)

# Print original data shapes
print("X=", X.shape, "y=", y.shape)
print("Original Regression Data shape:", X.shape, y.shape)

# Plot original data histogram
plt.hist(y, bins=20)
plt.title("Original Regression Data y values")
plt.show()
print("************************************")

# Initialize KNNOR_Reg
knnor_reg = data_augment.KNNOR_Reg()

# Perform data augmentation
X_new, y_new = knnor_reg.fit_resample(X, y, bins=20, target_freq=40)
y_new = y_new.reshape(-1, 1)

# Print augmented data shapes
print("After augmentation shape", X_new.shape, y_new.shape)
print("KNNOR Regression Data:")

# Plot augmented data histogram
plt.hist(y_new, bins=20)
plt.title("After KNNOR Regression Data y values")
plt.show()

# Print new data
new_data = np.append(X_new, y_new, axis=1)
print(new_data)
print("************************************")
Example implementation using a CSV file:
import matplotlib.pyplot as plt
import pandas as pd
import numpy as np
from knnor_reg import data_augment

knnor_reg = data_augment.KNNOR_Reg()

data = pd.read_csv("concrete.csv")
X = data.iloc[:, :-1].values
y = data.iloc[:, -1].values
print("X=", X.shape, "y=", y.shape)
print("Original Regression Data shape:", X.shape, y.shape)
plt.hist(y)
plt.title("Original Regression Data y values")
plt.show()
print("************************************")

X_new, y_new = knnor_reg.fit_resample(X, y, target_freq=40)
y_new = y_new.reshape(-1, 1)
print("After augmentation shape", X_new.shape, y_new.shape)
print("KNNOR Regression Data:")
plt.hist(y_new)
plt.title("After KNNOR Regression Data y values")
plt.show()
new_data = np.append(X_new, y_new, axis=1)
print(new_data)
print("************************************")Go to the example folder to see a Jupyter notebook with the implementation.
We show the effect of selecting different thresholds on our algorithm. We select the dataset "mortgage.csv" and demonstrate the results with various parameter values: number of neighbors (k) set to 4, proportion of minority points to be used set to 0.6, and the number of bins set to 6. The two figures illustrate the impact of different threshold values on the oversampling process.
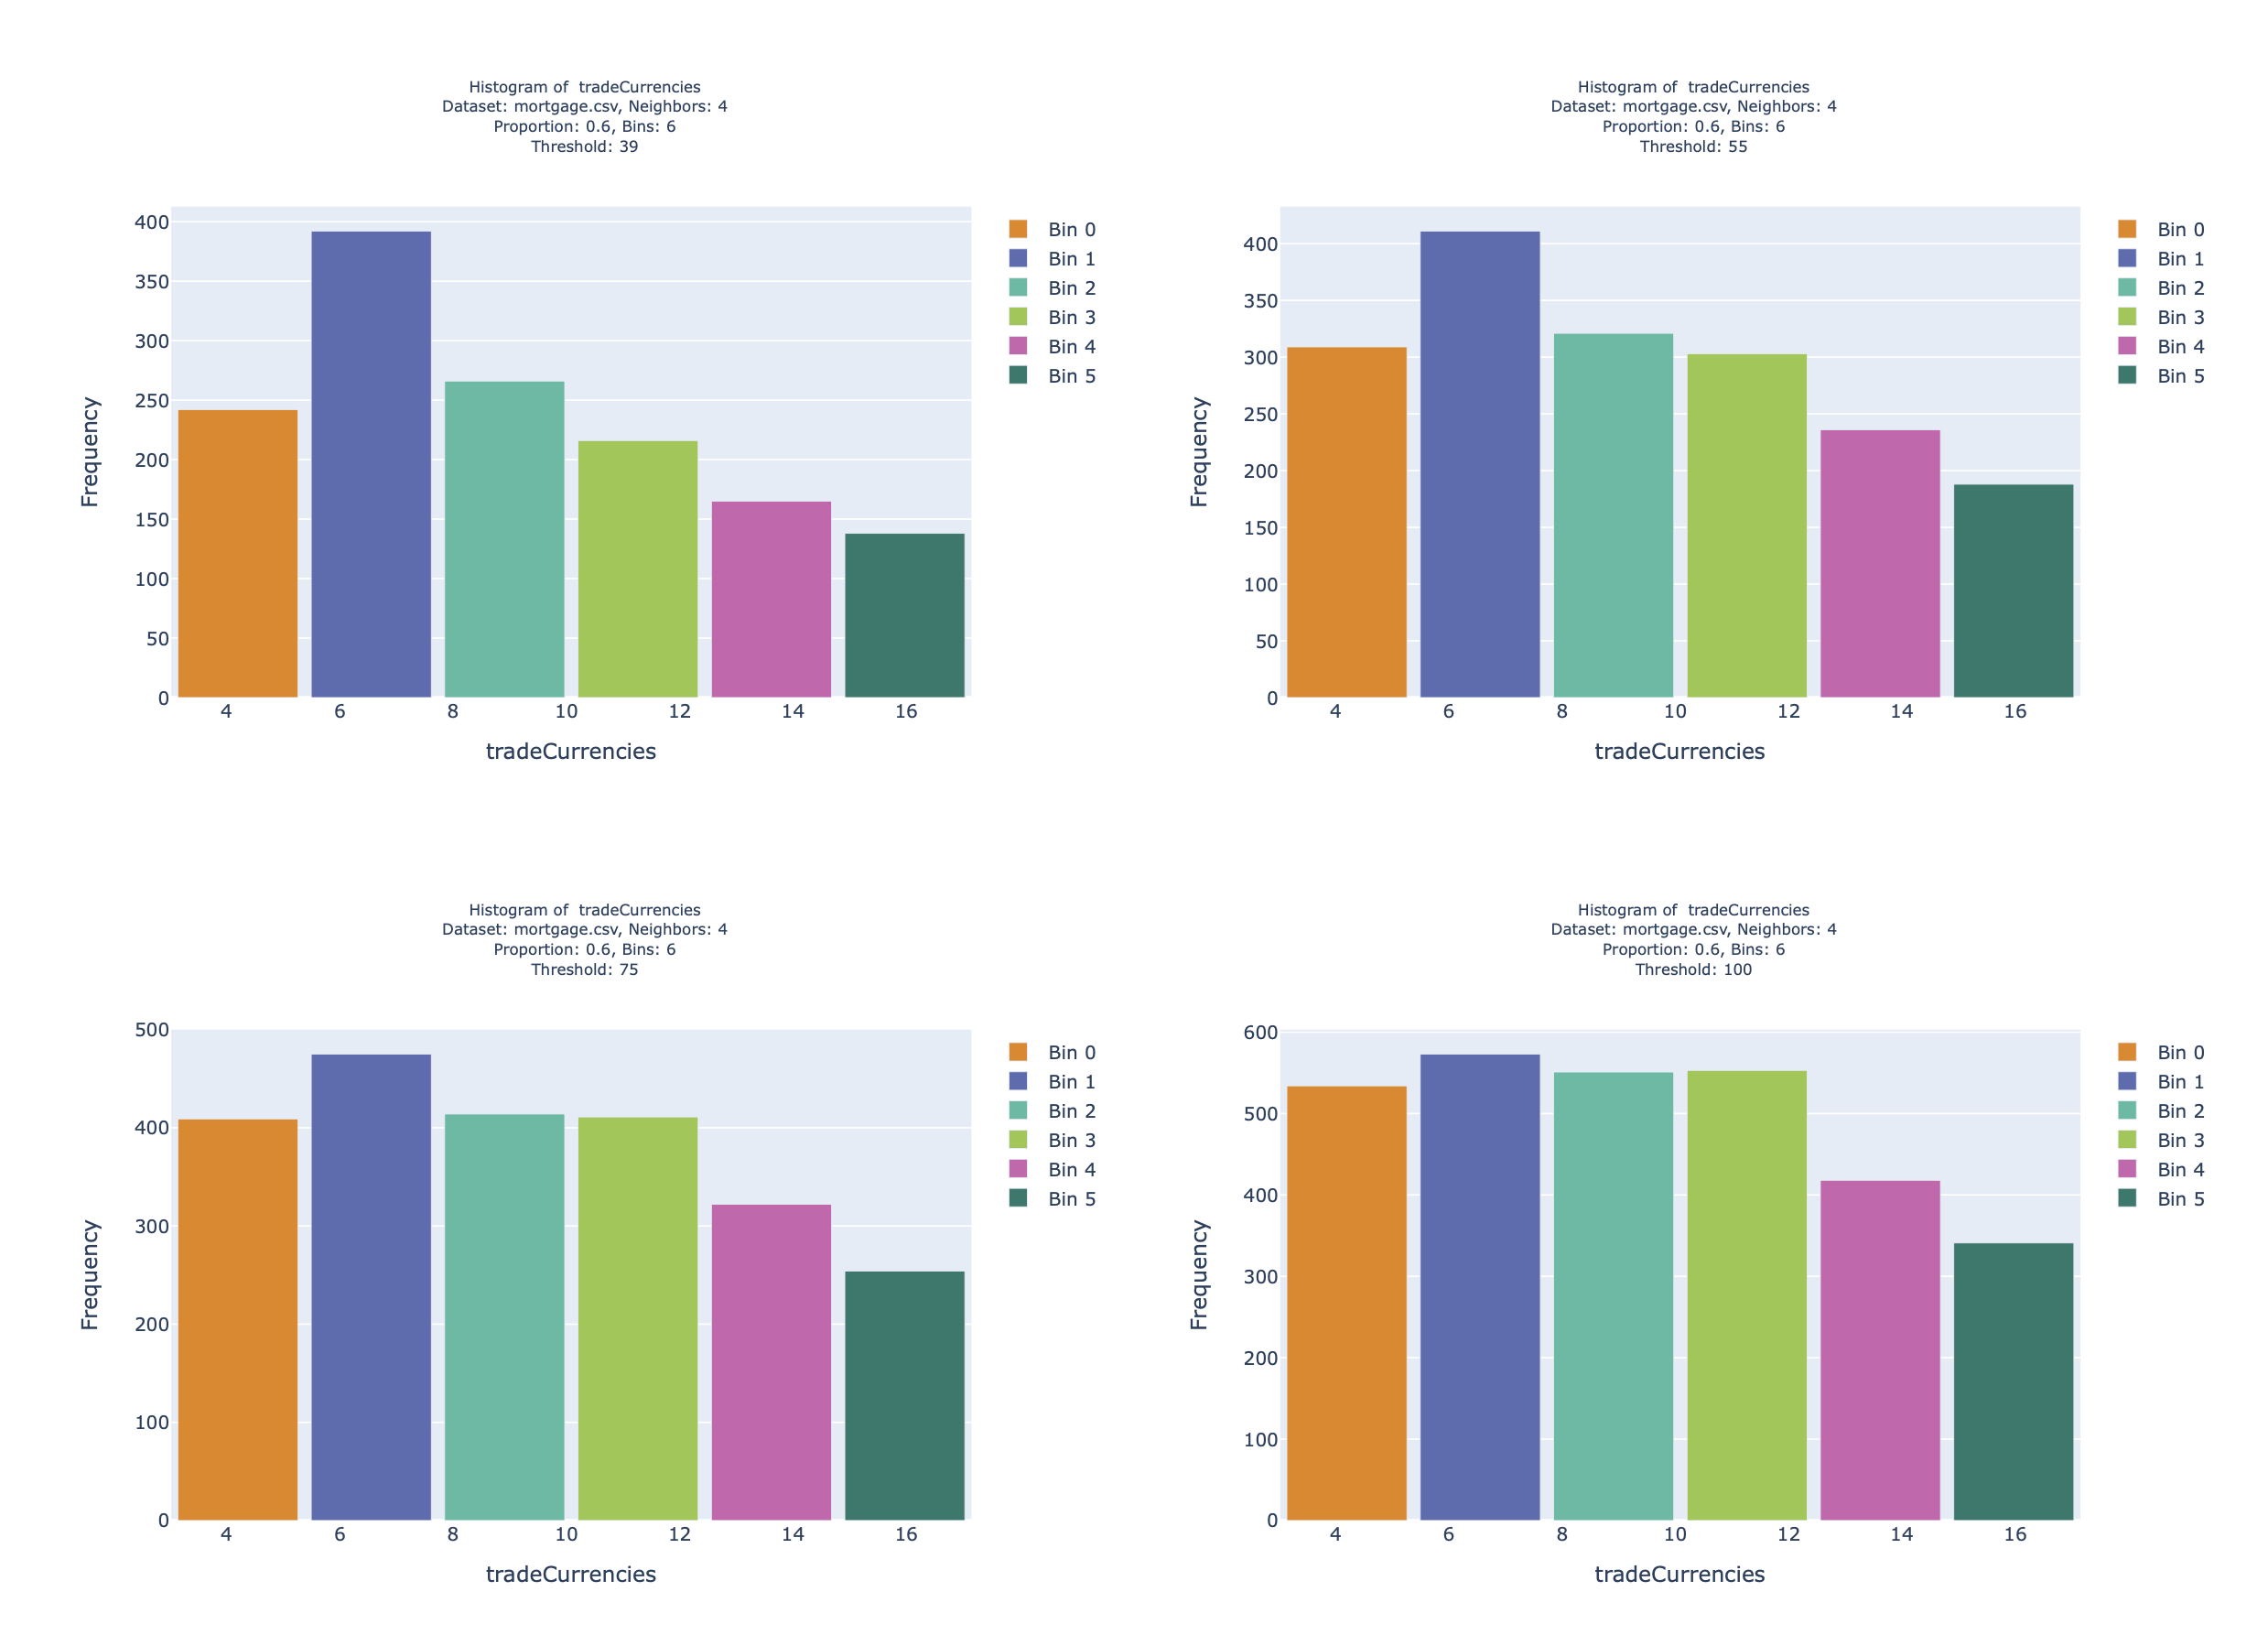 Histograms of the "tradeCurrencies" attribute with different threshold values (39, 55, 75, 100). Dataset: mortgage.csv, Neighbors: 4, Proportion: 0.6, Bins: 6.
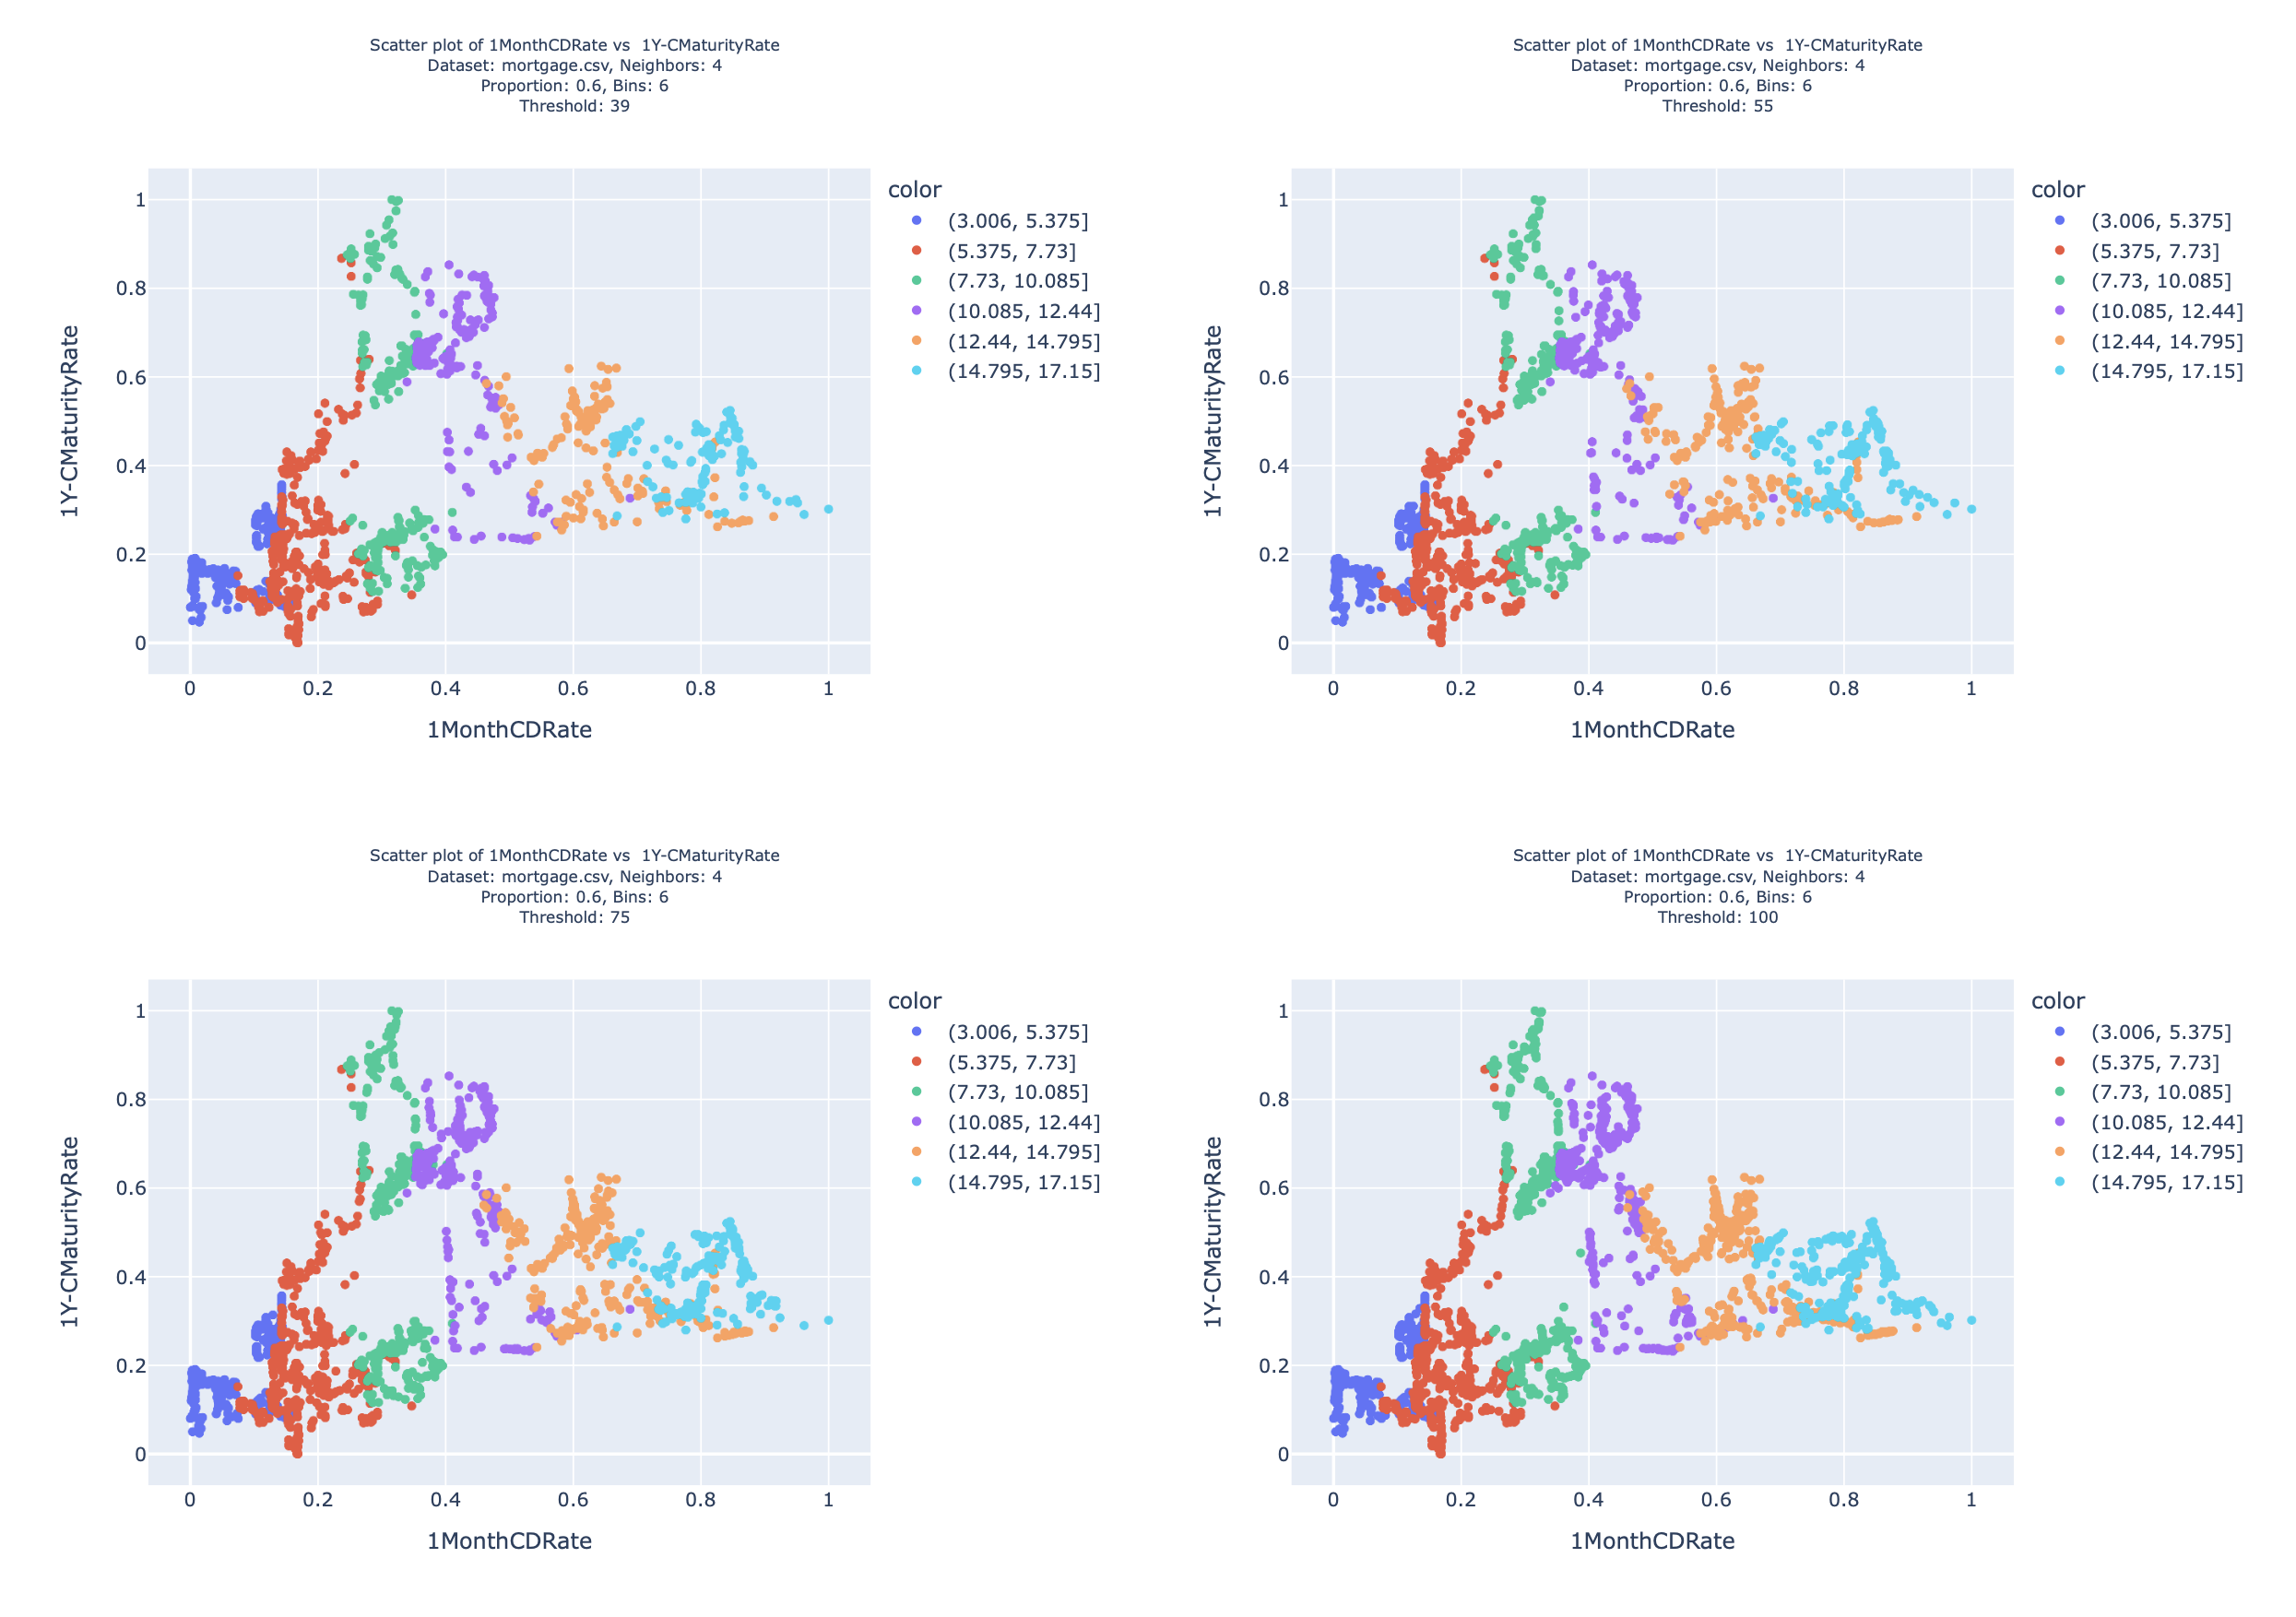 Scatter plots of "1MonthCDRate" vs "1Y-CMaturityRate" with different threshold values (39, 55, 75, 100). Dataset: mortgage.csv, Neighbors: 4, Proportion: 0.6, Bins: 6.
As observed in the figures above, as the threshold increases, the number of samples in the rarer range rises, aligning more closely with the majority range.
The documentation of the library is present at: [Link to Read the Docs]
If you are using this library in your research please cite the following papers:
- Belhaouari, S. B., Islam, A., Kassoul, K., Al-Fuqaha, A., & Bouzerdoum, A. (2024). Oversampling techniques for imbalanced data in regression. Expert Systems with Applications, 252, 124118. https://doi.org/10.1016/j.eswa.2024.124118
- Belhaouari, S. B., Islam, A., Kassoul, K., Al-Fuqaha, A., & Bouzerdoum, A. (2025). KNNOR-Reg: A python package for oversampling in imbalanced regression. Software Impacts, 100740.
- Islam, A., Belhaouari, S. B., Rehman, A. U., & Bensmail, H. (2022). KNNOR: An oversampling technique for imbalanced datasets. Applied Soft Computing, 115, 108288. https://doi.org/10.1016/j.asoc.2021.108288.
- Islam, A., Belhaouari, S. B., Rehman, A. U., & Bensmail, H. (2022). K Nearest Neighbor OveRsampling approach: An open-source python package for data augmentation. Software Impacts, 12, 100272. https://doi.org/10.1016/j.simpa.2022.100272
- Dr. Ashhadul Islam: ashhadulislam@gmail.com, asislam@mail.hbku.edu.qa
- Dr. Samir Brahim Belhaouari: samir.brahim@gmail.com, sbelhaouari@hbku.edu.qa
- Dr. Khelil Kassoul
- Dr. Ala Al-Fuqaha
- Dr. Abdesselam Bouzerdoum