

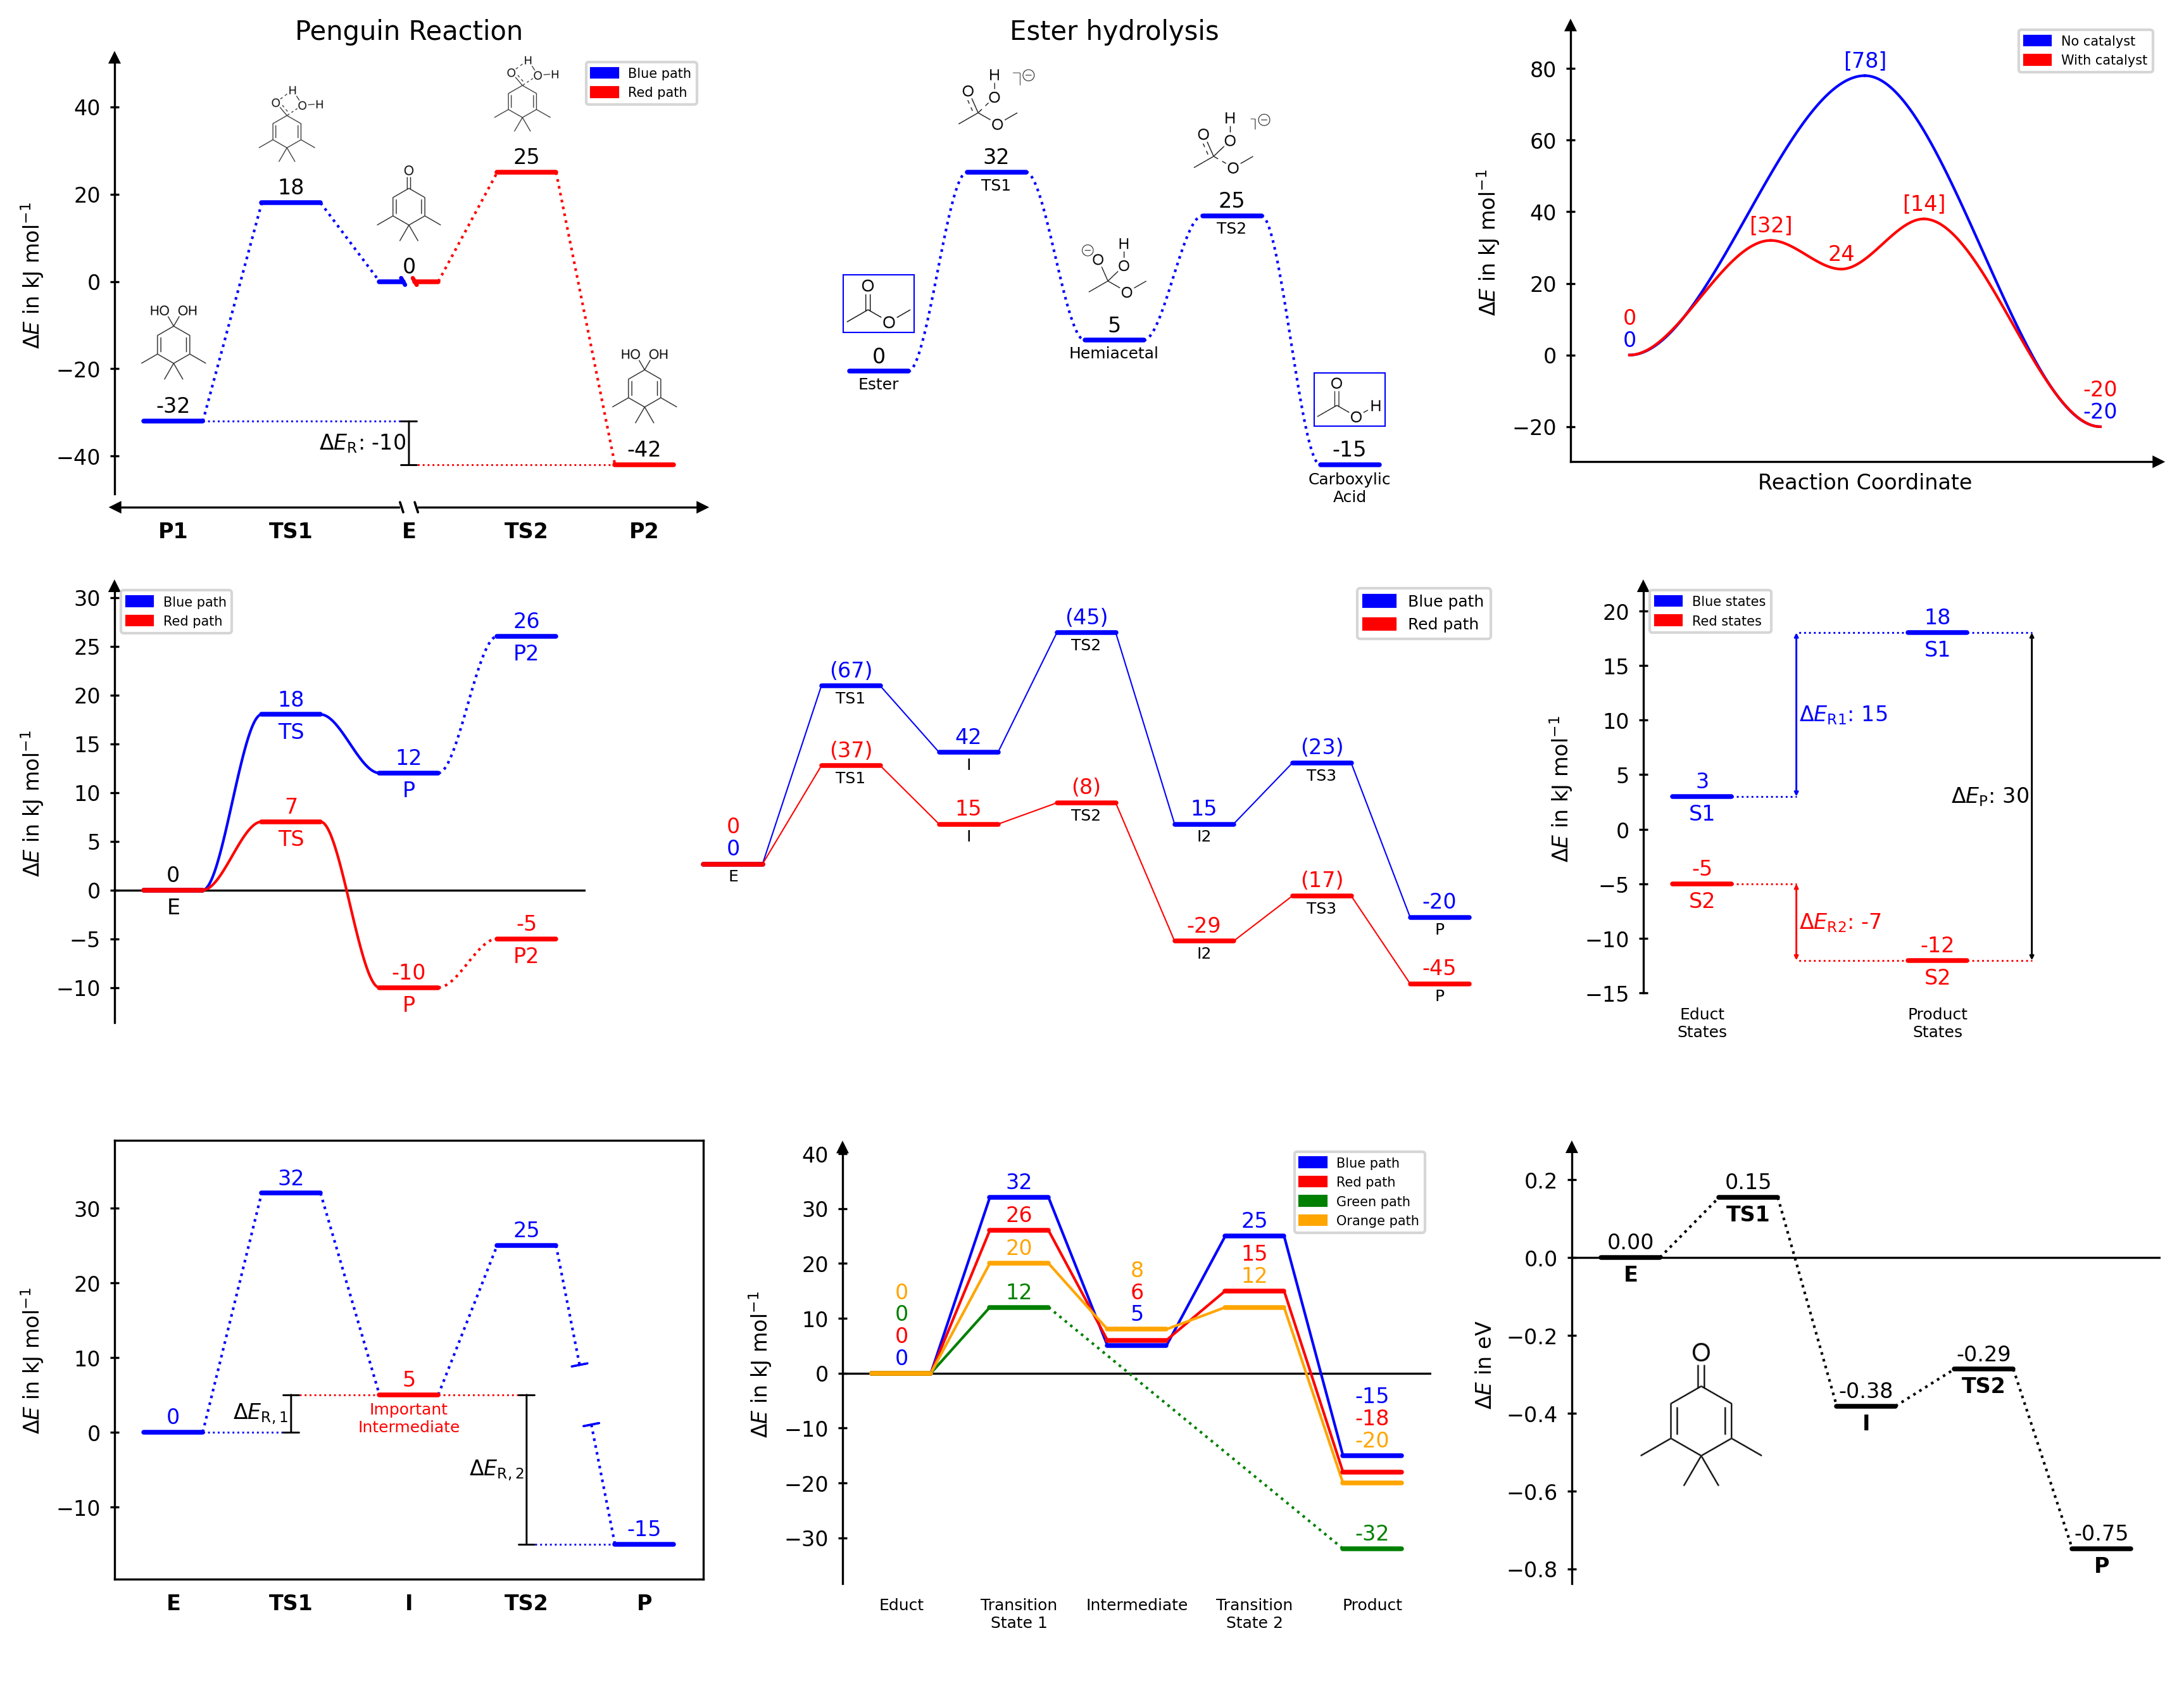
A Python package for creating publication-quality reaction energy diagrams with Matplotlib.
You can use the latest release by installing it from PyPi:
pip install chemdiagramsRequirements: Python ≥ 3.10, Matplotlib ≥ 3.7, NumPy ≥ 1.23, SciPy ≥ 1.10
- Multiple reaction paths on a single diagram
- Nine connector styles: dotted, solid, broken dotted, broken solid, spline dotted, spline solid, broken spline dotted, broken spline solid or none
- Five diagram styles:
open,halfboxed,boxed,twosided,borderless - Automatic, stacked, naïve, and averaged energy label placement (numbering)
- Custom text labels for each path at each position
- Energy difference bars with optional whiskers
- Axis break markers for both x and y axes
- Image placement along the diagram, with automatic collision avoidance and pixel-accurate scaling options
- Full access to the underlying Matplotlib objects for fine-grained customisation
- Customizable templates for consistent styling across multiple diagrams
- Possibility to insert multiple diagrams into a single figure using external Matplotlib axes (e.g. plt.subplots)
Full documentation with usage instructions, examples, and API reference is available at https://tonner-zech-group.github.io/chem-diagrams/.
from chemdiagrams import EnergyDiagram
dia = EnergyDiagram()
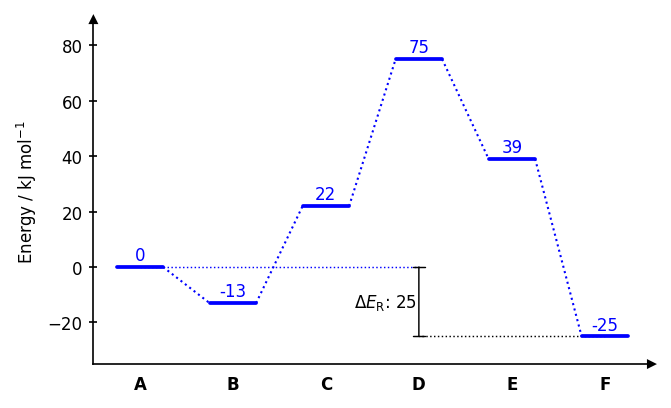
dia.draw_path(
x_data=[0, 1, 2, 3, 4, 5],
y_data=[0, -13, 22, 75, 39, 20],
color="blue",
path_name="Pathway A",
linetypes=[2, 3, 4, -1, 0],
)
dia.draw_path(
x_data=[0, 1, 2, 3, 5],
y_data=[0, -25, 20, 50, 6],
color="red",
path_name="Pathway B",
)
dia.legend(fontsize=7)
dia.add_numbers_auto()
dia.set_xlabels(["A", "B", "C", "D", "E", "F"])
dia.ax.set_ylabel("Energy / kJ mol$^{-1}$", fontsize=8)
dia.show()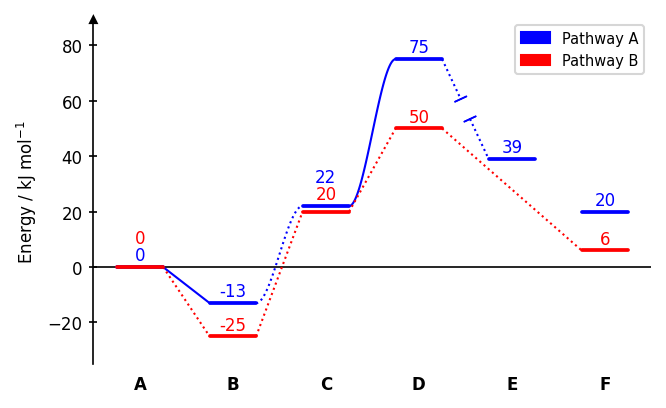
Connector styles (linetypes): 0 none, 1 dotted (default), -1 dotted with gap, 2 solid, -2 solid with gap, 3 dotted spline, -3 dotted spline with gap, 4 solid spline, -4 solid spline with gap. A single integer applies the same style to all segments.
dia = EnergyDiagram(style="halfboxed") # open | halfboxed | boxed | twosided | borderless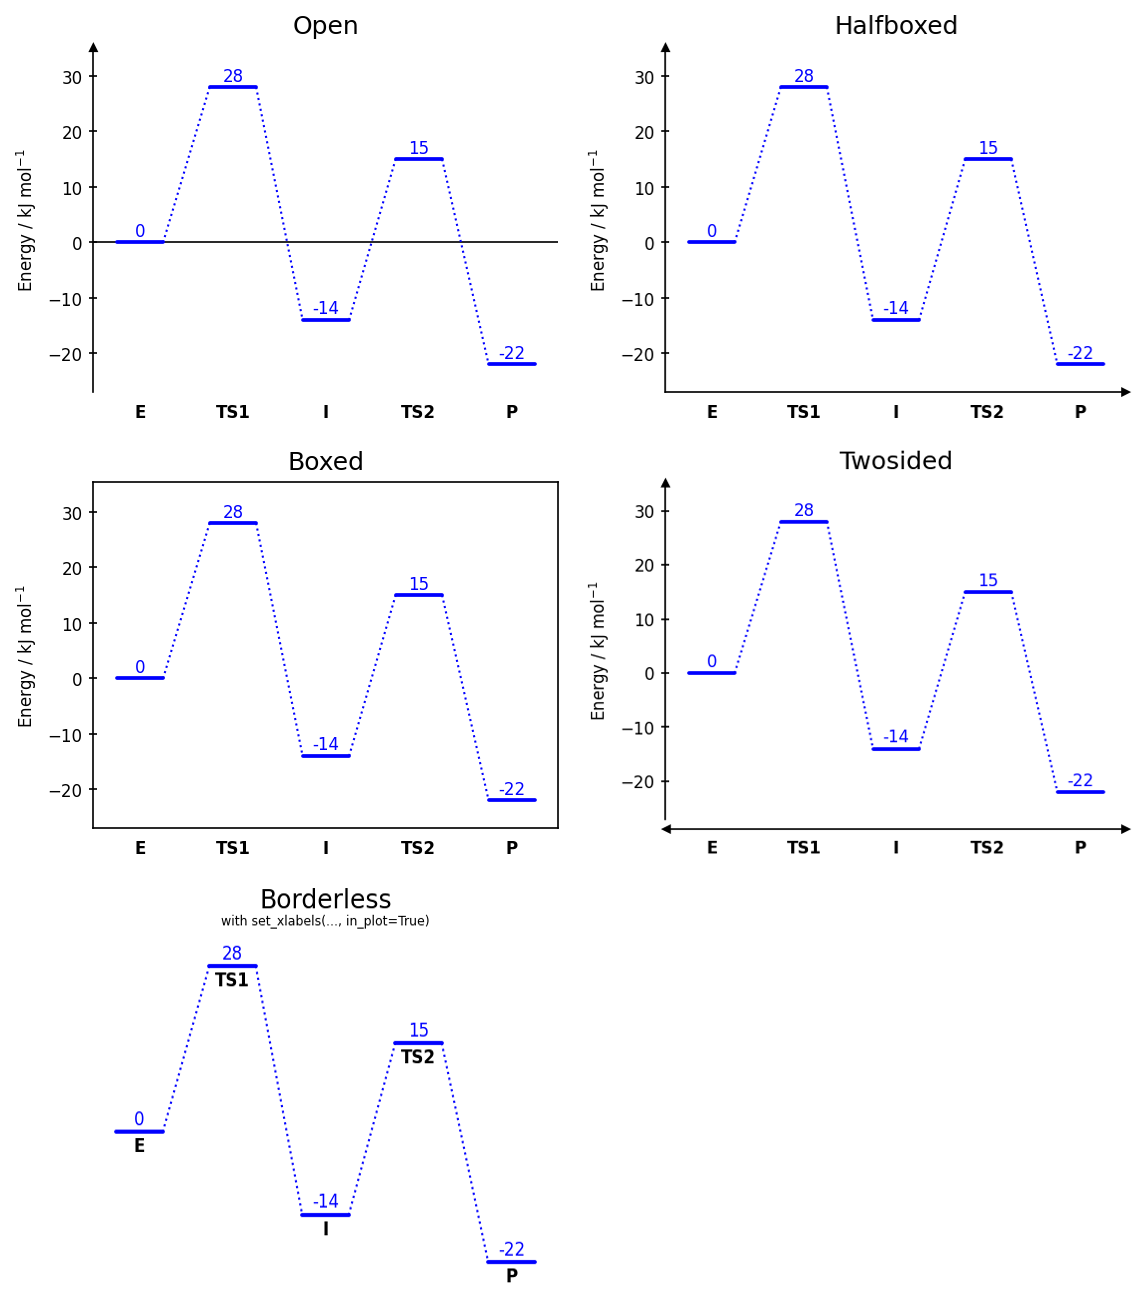
dia.add_numbers_auto()       # recommended
dia.add_numbers_stacked()
dia.add_numbers_naive()
dia.add_numbers_average()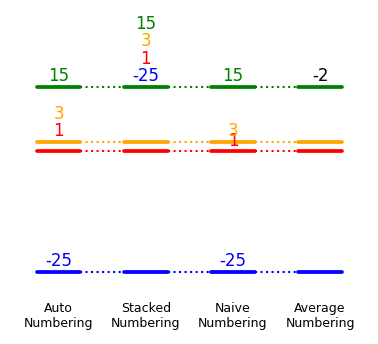
dia.draw_difference_bar(
    x=3,
    y_start_end=(-25, 0),
    description=r"$\Delta E_\mathrm{R}$: ",
    x_whiskers=(5, 0),
    left_side=True,
)
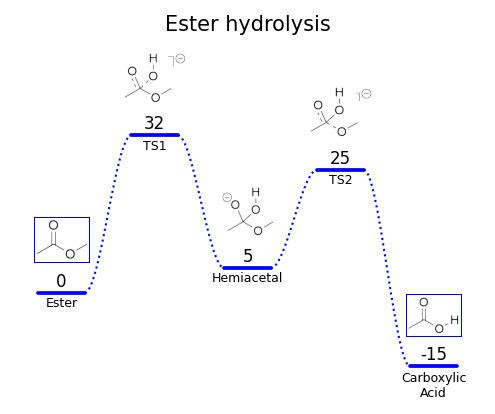
dia.add_image_series_in_plot(
    ["img0.png", "img1.png", "img2.png", "img3.png", "img4.png"],
    y_placement="auto",
    width=0.6,
    proportional_scaling=True,
)
dia.fig.savefig("diagram.png", dpi=300, bbox_inches="tight")
dia.fig.savefig("diagram.pdf", bbox_inches="tight")
For full documentation on all parameters and features, see https://tonner-zech-group.github.io/chem-diagrams/.
Examples can be found in the (documentation). A set of even more examples is available in examples/example_use.ipynb. The latter, however, is not actively maintained anymore and may be outdated with respect to the latest version of the package.
If you use chemdiagrams in published work, please consider citing the repository:
Tim Bastian Enders, chemdiagrams, https://github.com/Tonner-Zech-Group/chem-diagrams, https://doi.org/10.5281/zenodo.18957965
MIT — see LICENSE for details.