Data cleansing, analysis and dashboard using SQL and Excel
This project was developed as assignment of the SQL Impressionador course from HashtagTreinamentos.
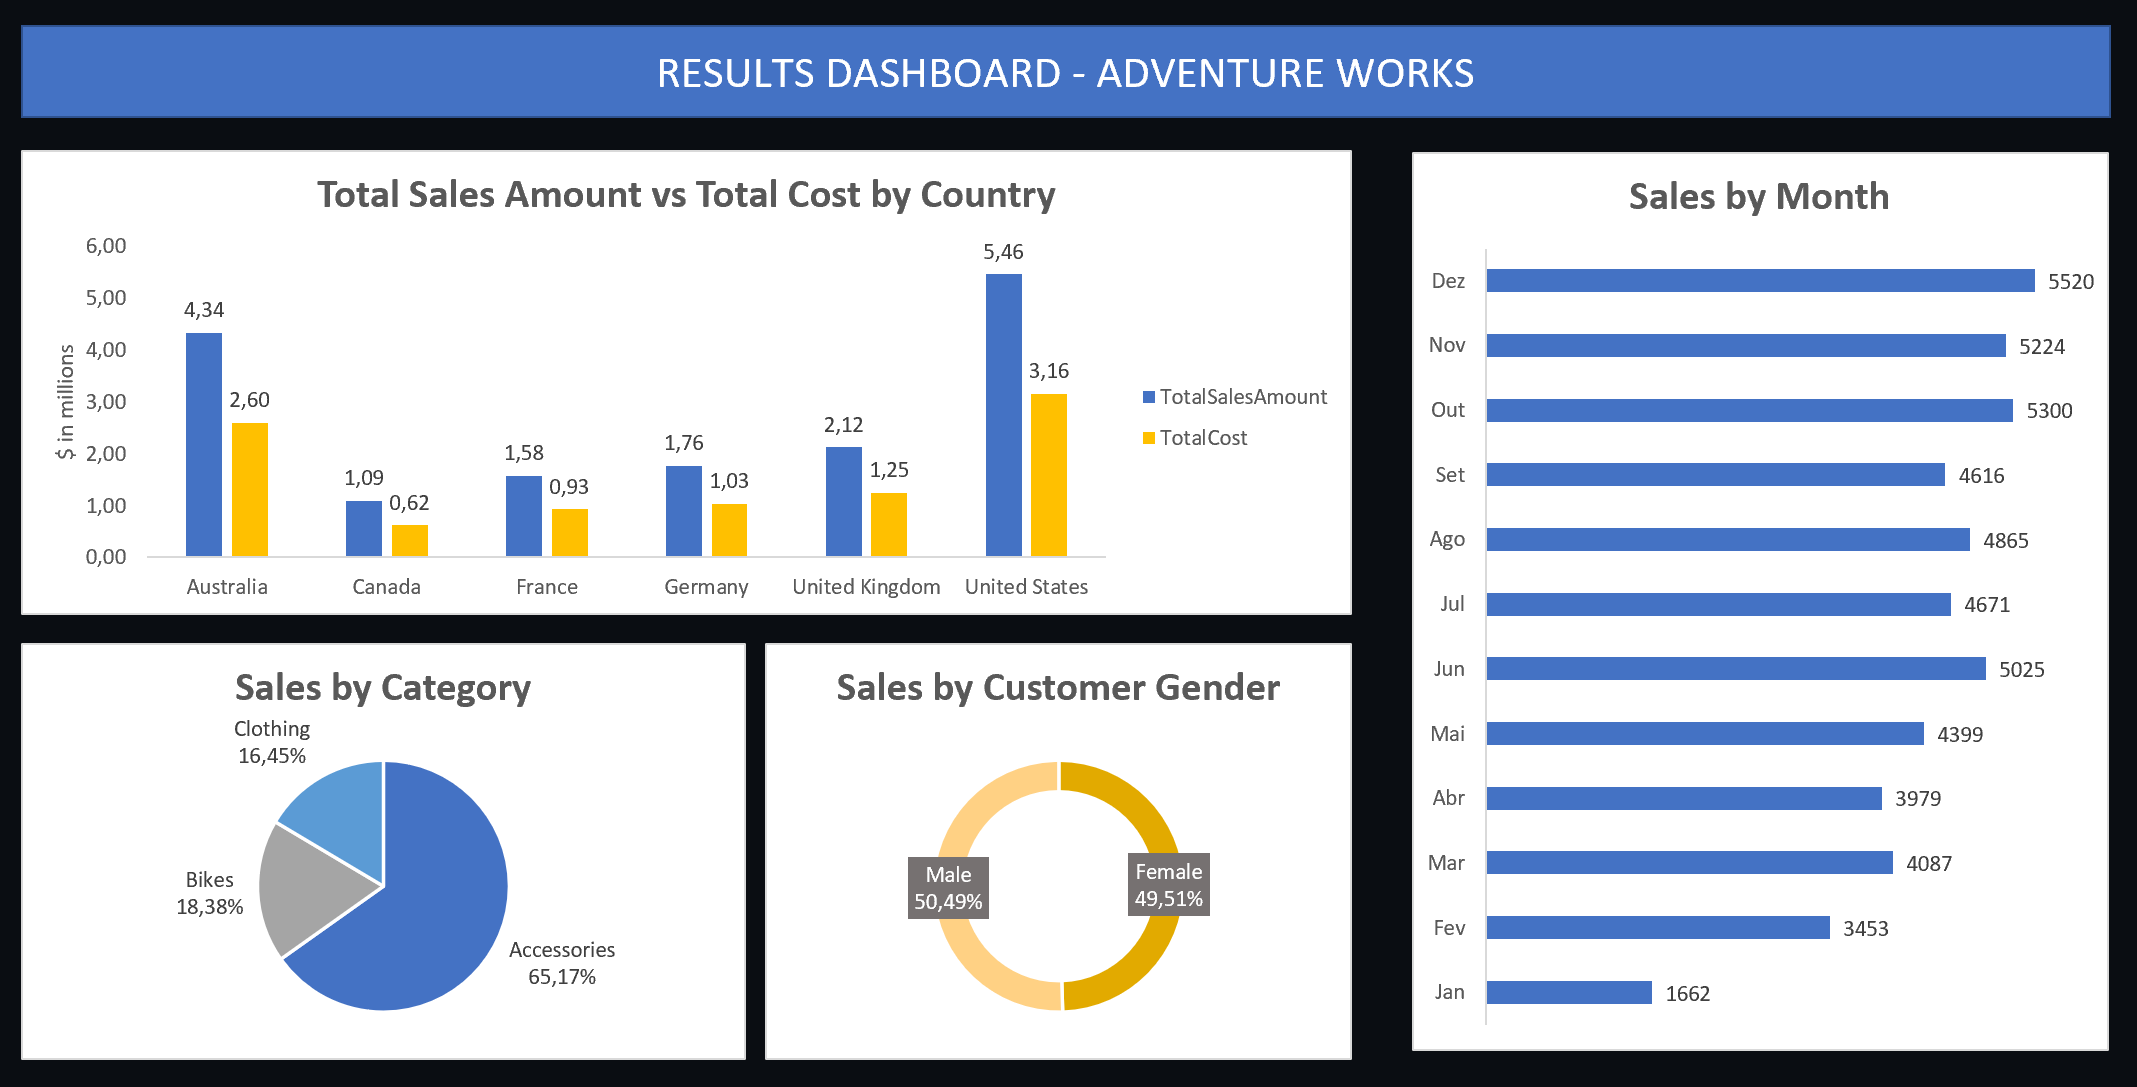
The project goal was to present, on a dashboard, 4 indicators obtained with the dataset AdvetureWorks2019 updated:
- Total Internet Sales by Category
- Total Internet Sales by OrderDate Month
- Total Internet Sales Amount vs Cost by Country
- Total Internet Sales by Gender
SQL: Joining and Filtering the Tables
Excel:
- Data formatting
- Creating PivotTables
- Creating Graphs and Dashboard
Data Update code: https://github.com/techtalkcorner/SampleDemoFiles/blob/master/Database/AdventureWorks/Update_AdventureWorksDW_Data.sql