











Most teams stop at accuracy. I ask: why did the model decide that — and can you prove it?
I'm a Machine Learning Engineer specializing in Explainable AI (XAI) and clinical ML systems. My work sits at the boundary between statistical rigor and software engineering — building pipelines that are not only high-performing but accountable.
My research uncovered what I call the Explainability Paradox: visually convincing saliency maps that fail causal validity tests. That finding is now under peer review.

Most evaluation stops at accuracy_score. TrustLens goes deeper.
A single analyze() call surfaces calibration drift, subgroup bias, failure patterns, and representation quality — the things that matter in production, but don't appear on leaderboards.
from trustlens import analyze

report = analyze(model, X_val, y_val, y_prob=proba)
# → Calibration · Bias · Failure Modes · Representation
Live on PyPI · Built with production CI/CD (multi-Python testing, Ruff, MyPy) · Active contributor community
→ Full writeup | PyPI package | Repository
Quantitative Faithfulness Benchmarking of CNNs vs. Vision Transformers: Implications for Clinical Trustworthiness
I Trained 3 different Models (VGG16, ViT B/16 and Custom CNN) and ran GradCAM++ and EigenCam on a chest X-ray dataset and found something counterintuitive: visually plausible heatmaps lacked causal validity. A 6-dimensional benchmark along with Pixel Deletion (AOPC/AUC) showed that patch-based Transformer attention was causally faithful where CNNs weren't — despite CNNs looking more "correct" to the human eye. I call this the Explainability Paradox.
Metrics used: Sparsity · Entropy · Inter-Method Agreement · AOPC/AUC · Bonferroni-corrected non-parametric testing
→ Project writeup | Repository
| System | Stack | Live | Highlight |
|---|---|---|---|
| CardioSense-AI | XGBoost · FastAPI · Docker · Optuna | 🟢 Live | 90.16% acc · 0.9524 AUC · "Least Effort Path" optimizer for patient intervention |
| Breast Cancer MLOps Suite | Random Forest · Z-Score Drift · Streamlit | 🟢 Live | 98.2% acc · Real-time out-of-distribution detection |
| Respiratory Disease Classifier | VGG16 · ViT-B/16 · GradCAM++ · LIME | Research | 99% recall for COVID-19 · Explainability Paradox discovery |
| Apple Sales Intelligence | Scikit-Learn · SciPy SLSQP · Streamlit | 🟢 Live | Constrained optimization for hardware-mix revenue maximization |
| Patient Safety Guardian | Gemini 2.5 Pro · Google ADK · Streamlit | 🟢 Live | Kaggle Agents Intensive · Multi-agent clinical safety net · 100% critical interaction detection |
I write derivation-first articles — intuition before formulas, complete proofs included. No hand-waving, no shortcuts.
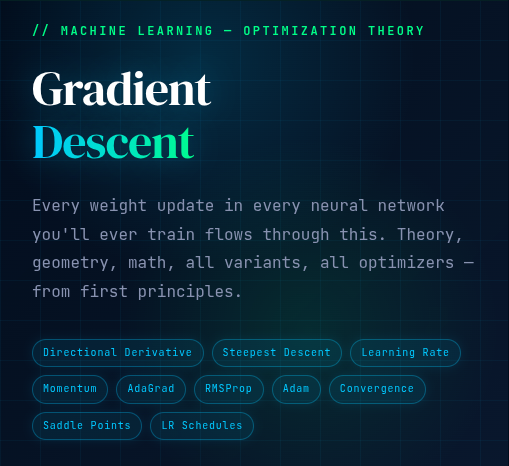 The workhorse of machine learning optimization.
A rigorous, ground-up treatment of how gradient descent navigates the loss landscape. Covers the derivation of partial derivatives and the chain rule in the context of multi-parameter loss functions, the geometry of steepest descent, and why learning rate choice is not arbitrary — too large diverges, too small stalls. Analyses convergence behavior, introduces momentum variants, and connects the mathematics to practical PyTorch training loops. Written for readers who want to truly understand why the optimizer works, not just how to call .backward().
 Constrained optimization — the math behind SVMs, regularization, and resource allocation.
When you can't just follow the gradient because the solution must satisfy a constraint, Lagrange multipliers are the tool. This article builds the method from its geometric foundations — explaining why the gradient of the objective must be parallel to the gradient of the constraint at a solution — and derives the KKT conditions used throughout modern ML. Covers the primal and dual problem formulation, the role of the Lagrangian, saddle-point interpretation, and worked examples in both geometric and analytical form. Directly applicable to understanding Support Vector Machine margins and constrained portfolio optimization.
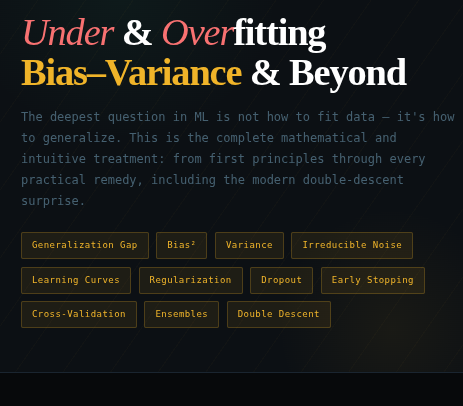 The single most important concept for building models that generalize.
Derives the bias-variance decomposition of expected test error from first principles, showing exactly how total prediction error decomposes into irreducible noise, squared bias, and variance components. Explains why high-capacity models overfit (low bias, high variance) while low-capacity models underfit (high bias, low variance) — and critically, why you cannot eliminate both simultaneously. Connects the trade-off to regularization, ensemble methods, and cross-validation strategy. A must-read before tuning any model's capacity or regularization strength.
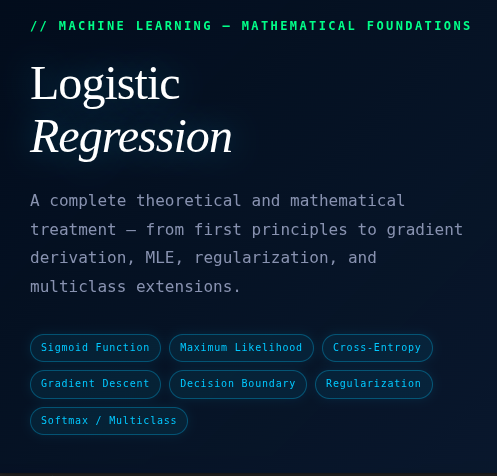 From continuous predictions to calibrated class probabilities — the complete derivation.
Walks through the motivation for squashing linear outputs through the sigmoid function, deriving its form from the odds-ratio and log-odds perspective. Constructs the Binary Cross-Entropy loss function from scratch using Maximum Likelihood Estimation over the Bernoulli distribution, then derives its gradient with respect to model weights — revealing the elegant result that the gradient takes the same form as linear regression's residual. Covers numerical stability considerations (log-sum-exp trick), the probabilistic interpretation of outputs, and why logistic regression is not just a classifier but a calibrated probabilistic model.
ML / DL          PyTorch · XGBoost · Scikit-Learn · VGG16 · ViT · Optuna
XAI              SHAP · LIME · GradCAM++ · EigenCAM · Pixel Deletion (AOPC/AUC)
MLOps            FastAPI · Docker · GitHub Actions CI/CD · Streamlit · REST APIs
Data Engineering Python · SQL · Pandas · NumPy · PCA · K-Means · Plotly
Drift Detection  Z-Score · Counterfactual Analysis · Synthetic Stress Testing
|
|
|
|
|
|
|
"In God we trust. All others must bring data." — W. Edwards Deming
If your model can't explain itself, it has no business making decisions.