It's time to automate the basic reporting for our application. Let's set up an automatic sending of an analytical summary to Telegram every morning! Here's what we need to do:
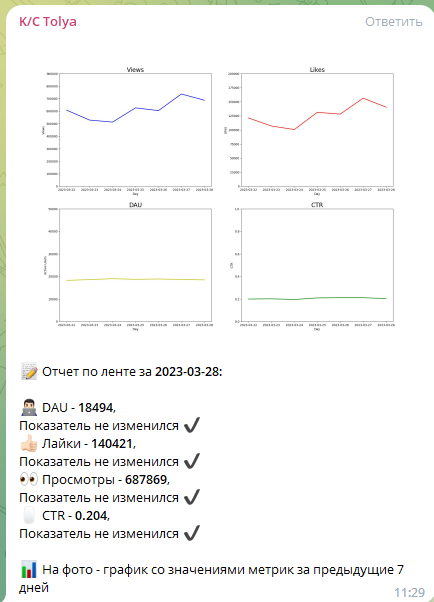
Create your own Telegram bot using @BotFather To get the chat_id, use the link https://api.telegram.org/bot<your_bot_token>/getUpdates or the bot.getUpdates() method Write a script to generate a report on the news feed. The report should consist of two parts: Text with information about the values of key metrics for the previous day A graph with metric values for the previous 7 days Display the following key metrics in the report:
- DAU
- Views
- Likes
- CTR
Automate the report sending with Airflow. Place the code for generating the report in GitLab by following these steps:
- Clone the repository
- Inside the dags folder of your local copy, create a folder with the same name as your GitLab username, which should include the @ symbol
- Create a DAG in that folder, which should be in a .py file format
- Push the results to GitLab
- Enable the DAG when it appears in Airflow The report should be sent every day at 11:00 AM in the chat.
Creating a Telegram Bot
- Open the Telegram app and search for the @BotFather bot.
- Send the command /newbot to @BotFather.
- Follow the prompts to create your bot and receive the bot token.
- Save the bot token for later use.
- Open a web browser and enter the following link, replacing <your_bot_token> with the bot token you received from @BotFather: https://api.telegram.org/bot<your_bot_token>/getUpdates
- Send a message to your bot on Telegram.
- Refresh the web page and look for the chat_id value in the JSON response.
- Save the chat_id for later use.
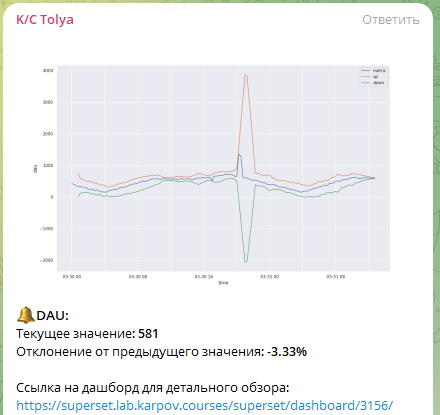
This project aims to build an alert system for our application to periodically check key metrics, such as active users in the feed/messenger, views, likes, CTR, and the number of sent messages. It detects anomalies in the metrics using statistical methods.
- Periodically checks key metrics every 15 minutes
- Detects anomalies using statistical methods
- Sends alerts to a chat with information about the metric, its value, and the deviation magnitude
- Provides additional information, such as graphs and links to BI dashboards and charts to investigate the anomaly