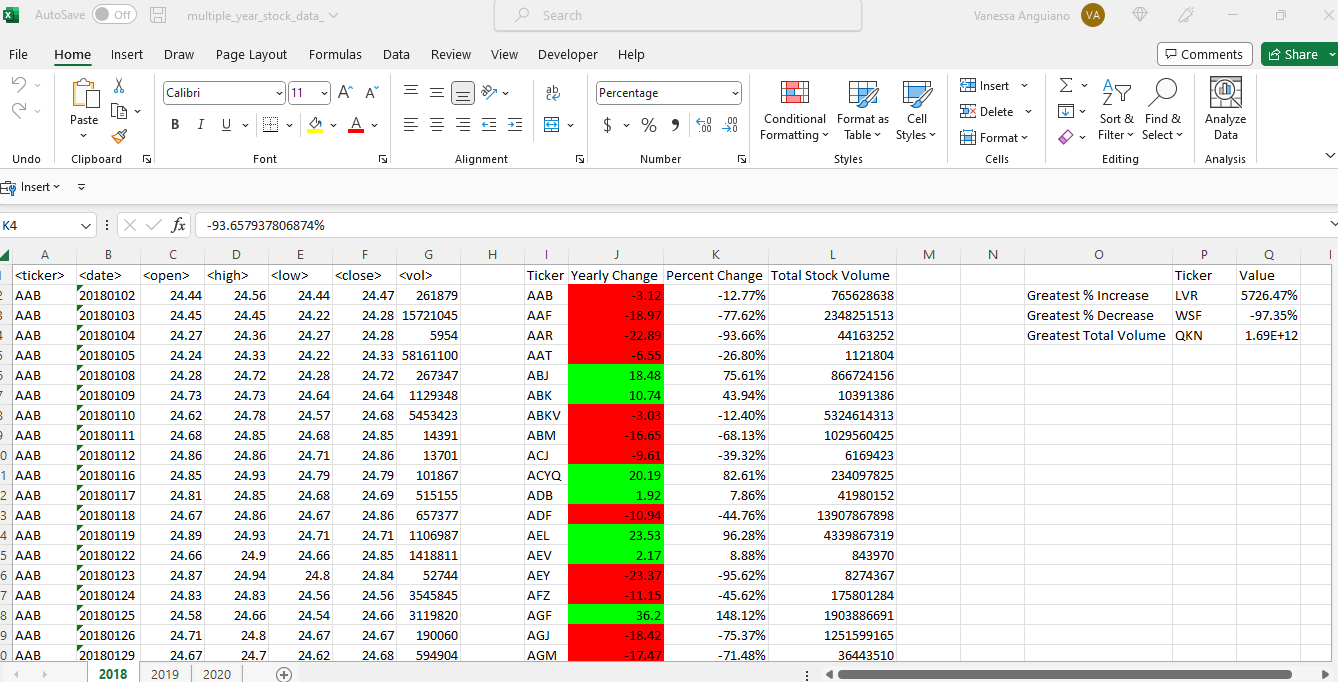
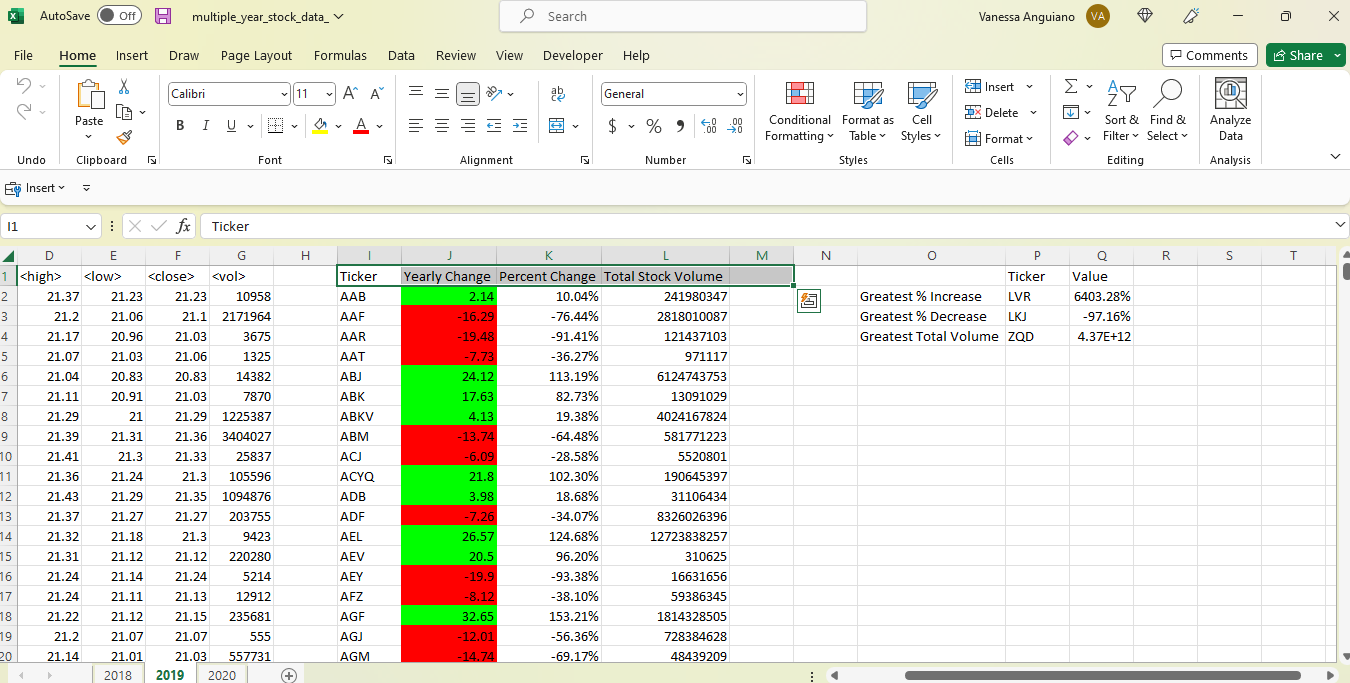
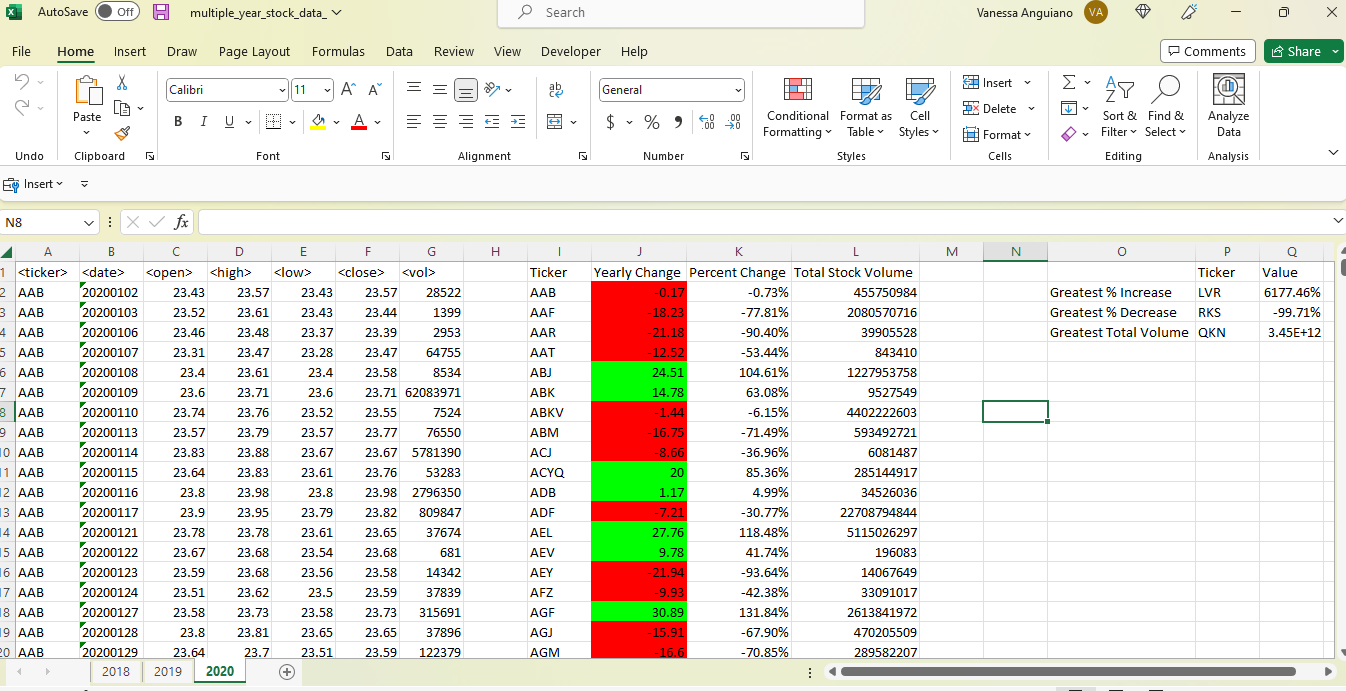
Below are the results for the Stock Data Analysis. This is the code I used to successfully yield the following: summary table including ticker, yearly change, percent change, and total stock volume; and a table showing the greatest % increase, greatest % decrease, and greatest total volume. These values allow one to analyze how the stocks fluctuate throughout the year.
Sub stock_data()

'Loop through all worksheets
For Each ws In Worksheets
ws.Activate

'Define all variables

Dim i, ticker_row, s_lastRow As Integer
ticker_row = 2

Dim lastRow As Long

Dim Ticker As String

Dim yChange, pChange, volume, open_p, close_p As Double
volume = 0


    'Define last row
    lastRow = ws.Cells(Rows.Count, 1).End(xlUp).Row

    'Label header rows
    ws.Cells(1, 9).Value = "Ticker"
    ws.Cells(1, 10).Value = "Yearly Change"
    ws.Cells(1, 11).Value = "Percent Change"
    ws.Cells(1, 12).Value = "Total Stock Volume"

    'Autofit columns I-M
    ws.Range("J:L").Columns.AutoFit


    'Loop through to extract needed info
    For i = 2 To lastRow

        'Creating breaks among tickers
        If ws.Cells(i + 1, 1).Value <> ws.Cells(i, 1).Value Then

            'Assign ticker value to column I
            Ticker = ws.Cells(i, 1).Value
            ws.Range("I" & ticker_row).Value = Ticker

            'Add volume and print to column L
            volume = volume + ws.Cells(i, 7).Value
            ws.Range("L" & ticker_row).Value = volume

            'Set initial open & close price, other open prices will be changed
            open_p = ws.Cells(2, 3).Value
            close_p = ws.Cells(i, 6).Value

            'Calculate yearly change and print values to column J
            yChange = (close_p - open_p)
            ws.Range("J" & ticker_row).Value = yChange

            'Calculate percent change and check for non-divisibility
            If open_p = 0 Then
                pChange = 0

            Else
                pChange = yChange / open_p
            End If

            'Print yearly change in column K
            ws.Range("K" & ticker_row).Value = pChange
            ws.Range("K" & ticker_row).NumberFormat = "0.00%"

            'Reset row counter
            ticker_row = ticker_row + 1

            'Reset volume to 0
            volume = 0

            'Reset the opening price
            open_p = ws.Cells(i + 1, 3)

        Else

            'Add the volume
            volume = volume + ws.Cells(i, 7).Value

        End If


    Next i

'Need to find last row of summary table to format column J

s_lastRow = ws.Cells(Rows.Count, 9).End(xlUp).Row

'Assign red for negative numbers and green for positive
    For i = 2 To s_lastRow

        If ws.Cells(i, 10).Value > 0 Then
            ws.Cells(i, 10).Interior.Color = vbGreen

        Else
            ws.Cells(i, 10).Interior.Color = vbRed
        End If

    Next i

    'Label additional chart
        ws.Cells(2, 15).Value = "Greatest % Increase"
        ws.Cells(3, 15).Value = "Greatest % Decrease"
        ws.Cells(4, 15).Value = "Greatest Total Volume"
        ws.Cells(1, 16).Value = "Ticker"
        ws.Cells(1, 17).Value = "Value"

        ws.Range("O2:O4").Columns.AutoFit

    'Loop through summary table to find max and min values, include ticker name
    For i = 2 To s_lastRow

        'Find max percent change in column K
        If ws.Cells(i, 11).Value = Application.WorksheetFunction.Max(ws.Range("K2:K" & s_lastRow)) Then
            ws.Cells(2, 16).Value = ws.Cells(i, 9).Value
            ws.Cells(2, 17).Value = ws.Cells(i, 11).Value
            ws.Cells(2, 17).NumberFormat = "0.00%"

        'Find min percent change in column K
        ElseIf ws.Cells(i, 11).Value = Application.WorksheetFunction.Min(ws.Range("K2:K" & s_lastRow)) Then
            ws.Cells(3, 16).Value = ws.Cells(i, 9).Value
            ws.Cells(3, 17).Value = ws.Cells(i, 11).Value
            ws.Cells(3, 17).NumberFormat = "0.00%"

        'Find max volume in column L
        ElseIf ws.Cells(i, 12).Value = Application.WorksheetFunction.Max(ws.Range("L2:L" & s_lastRow)) Then
            ws.Cells(4, 16).Value = ws.Cells(i, 9).Value
            ws.Cells(4, 17).Value = ws.Cells(i, 12).Value

        End If

    Next i

 Next ws

End Sub