Hi, thanks for the package - been using it for a while now.
I recently started using {showtext} to make use of extra fonts in my ggplots. However, I noticed that after running the required showtext::showtext_auto(), the exported .pptx have issues with their text - see the screenshot below.
library(export)
library(ggplot2)
library(showtext)
showtext::showtext_auto()

p <- ggplot(data = PlantGrowth,
            aes(y = weight, x = group)) +
  geom_point() +
  labs(title = "This is a relevant title",
       subtitle = "Here is also a subtitle",
       caption = "And here is a caption")

p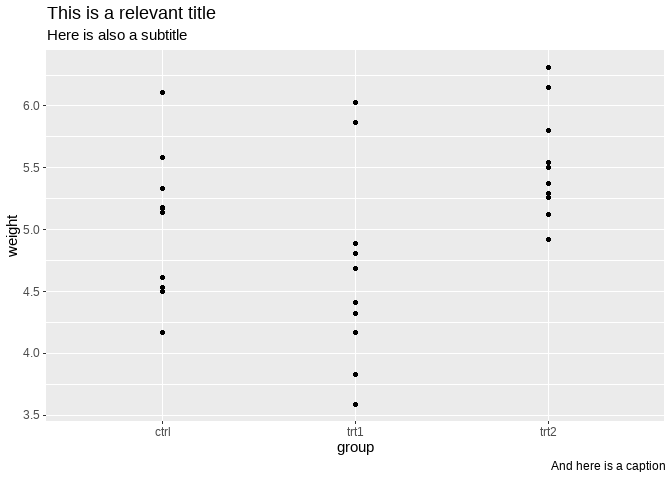
export::graph2ppt(p, file = "Rplot")
#> Exported graph as Rplot.pptx
Created on 2022-01-19 by the reprex package (v2.0.1)
This is a Screenshot of Rplot.pptx:

Ultimately, I have these questions:
- Is there a fix for this so that I can use {showtext} in combination with
graph2ppt()?
- Taking a step back - the only reason I am exporting to
pptx in the first place is to get the figures in my docx files to be as crisp-looking as possible. I achieve this via copying the graph from the pptx file and pasting it into word as an enhanced metafile. Does this sound reasonable to you or do you have a better suggestion?
- I usually export my plots as
pdf, png and pptx. The first two I could do via ggsave(), but I actually only do so for pdf and subsequently run pdftools::pdf_render_page(pdf_path, page = 1, dpi = 300) %>% png::writePNG(bitmap, png_path) (see my custom export function). This seems to do the trick of always having the same font sizes and scales for both of these two exported files. Does this sound reasonable to you? Should I try to take a similar approach here with e.g. pdf2pptx::pdf2pptx()?
Hi, thanks for the package - been using it for a while now.
I recently started using {showtext} to make use of extra fonts in my ggplots. However, I noticed that after running the required
showtext::showtext_auto(), the exported.pptxhave issues with their text - see the screenshot below.Created on 2022-01-19 by the reprex package (v2.0.1)
This is a Screenshot of

Rplot.pptx:Ultimately, I have these questions:
graph2ppt()?pptxin the first place is to get the figures in mydocxfiles to be as crisp-looking as possible. I achieve this via copying the graph from thepptxfile and pasting it into word as an enhanced metafile. Does this sound reasonable to you or do you have a better suggestion?pdf,pngandpptx. The first two I could do viaggsave(), but I actually only do so for pdf and subsequently runpdftools::pdf_render_page(pdf_path, page = 1, dpi = 300) %>% png::writePNG(bitmap, png_path)(see my custom export function). This seems to do the trick of always having the same font sizes and scales for both of these two exported files. Does this sound reasonable to you? Should I try to take a similar approach here with e.g.pdf2pptx::pdf2pptx()?