So we have a very nice plot for the ReactionTime Intensity now.
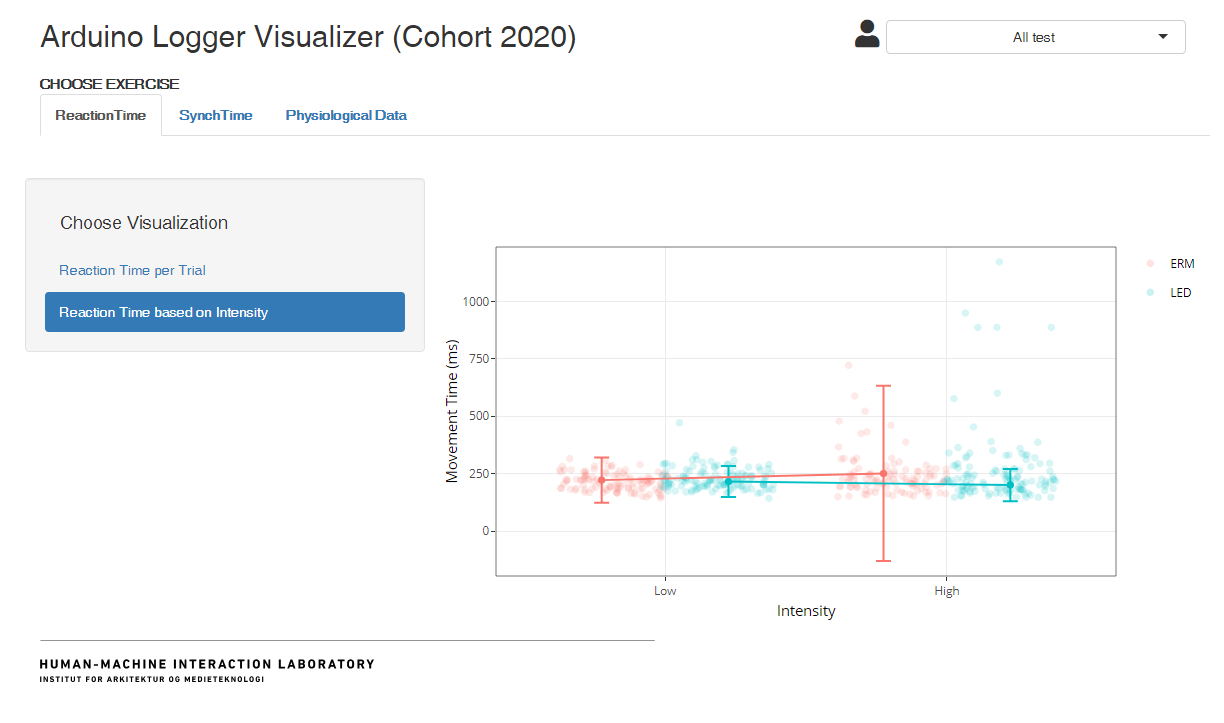
What data would be interesting to display in context of this plot? (for students, for researchers).
A few ideas:
- Set an upper limit on reaction time to 0-500ms, and indicate in metadata that there are X/Y amount of datapoints outside the limit.
- Describe that the confidence intervals are 0.95, and show the numbers they represent visually underneath.
- Describe medians for LED/ERM and for the different intensities.
- Describe the complete number of datapoints available in the point, and what dates they range from.
@hendrikknoche do you have further input on useful data aggregates/metadata that will help understanding the narrative the plot is giving?
So we have a very nice plot for the ReactionTime Intensity now.

What data would be interesting to display in context of this plot? (for students, for researchers).
A few ideas:
@hendrikknoche do you have further input on useful data aggregates/metadata that will help understanding the narrative the plot is giving?